Best Near-Term Price Gains Ahead For: Dow Jones 30 Stocks
We have a special way of looking at stocks and ETFs
If you have seen this explanation before, please jump to the next bold-faced headline.
Technology advances in communications and information have transformed the way securities markets operate, and the way major investors behave as a result. Prices of equities now normally gyrate during one-year elapsed periods in ranges that are typically multiples of the underlier’s trend growth.
Which means that during part of the year period their prices are retreating, and are consuming investments of time which cause the “growth” trend rates to be far less than what their better progress periods provide.
Advances in information technology encourage investment professionals (the market-making [MM] community) to protect the capital they must put at risk to do their jobs. Those actions cause the markets for equities and derivatives to become more integrated than they were in much of the 20th century.
So we study what the Pros’ behavior causes to happen in the price-change “insurance” derivatives markets, to understand just how far it is reasonable to believe specific stock and ETF prices may move, both up and down, in the next few months.
This analysis has been conducted without material change daily for over a decade on more than 2500 widely-held and actively-traded stocks and ETFs. The resulting price range forecasts provide an actuarial history (unmatched elsewhere in the investment community) of subsequent market prices, as testimony to the strength or weakness of the forecasts made earlier.
Near-term price gains are most important to investors who are now either starting out in building a portfolio’s wealth and exploring how it may best be done, or to investors who have come to realize that plans made years earlier are unlikely to be met at current rates of investment wealth accumulation.
Active investing, where capital is constantly put to work in the best odds-on situations to deliver profit within foreseeable time horizons, is the strategy most likely to produce what is needed, at least risk. But active investing needs guidance as to what to do, when to do it, and with what intensity.
What’s going on in the market for stocks now?
At this point in time there are wobbly canaries in the market coal mine. The perceptions of market professionals see over three-quarters of ETFs with leveraged long holdings as having larger price drawdown exposures than upside gain prospects.
They see less than a third of those ultra-price-sensitive ETFs as having credible upside prospects. Only five out of those 40+ ETFs have a combination of credible upside forecasts larger than their downside risks.
The market “Music Man” would say: “Folks, you got trouble. Right here in Investment City. Trouble begins with T and that rhymes with P and that stands for Prices.”
Can 76 (or some number) of the “right stocks” bring calm and prosperity back to our beloved neighborhood? Let’s look at the most promising issues in the Dow Jones 30 Index to see if they have a more hopeful prospect.
The Dow Jones 30 Index Stocks
Figure 1
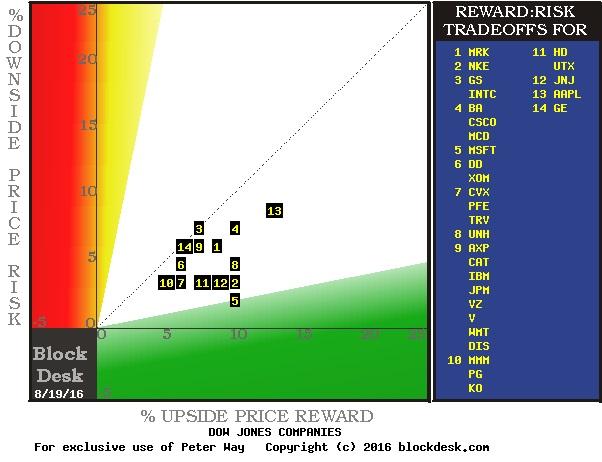
(used with permission)
Each stock is positioned in this map by its intersection of upside price change forecast on the green horizontal scale and the price drawdown exposures (on the red vertical scale) typical after prior forecasts like today’s. Any issue above the dotted diagonal has more potential risk than return at its present price.
So what we see is a lot more hopeful than the concerns reflected by the Leveraged-Long crowd. Here nearly all issues have healthy risk~reward balances, while only two are walkin’ the wire. There’s many alternatives to the two bordering trouble.
Since price-change risk is a dynamic, not a constant, in time these exposure relationships will change. But right now there are opportunities for gains as well. What else might create trouble? Let’s look at how today’s forecasts have performed previously.
Other useful details from similar prior forecasts
The following table, on each row, contains first the current hedging-derived price range forecast for the symbol indicated. Then each row shows dimensions of investment interest for that security drawn from all prior forecasts of the past 5 years which had upside to downside proportions like the Range Index shown in column (7).
We compare equity investments this way because long experience shows that each security develops an individual market persona. By selecting all prior dates when each stock had expectations with similar proportions to the way they are now being considered, comparisons can be made between issues that would otherwise not be seen as proper equals.
Figure 2
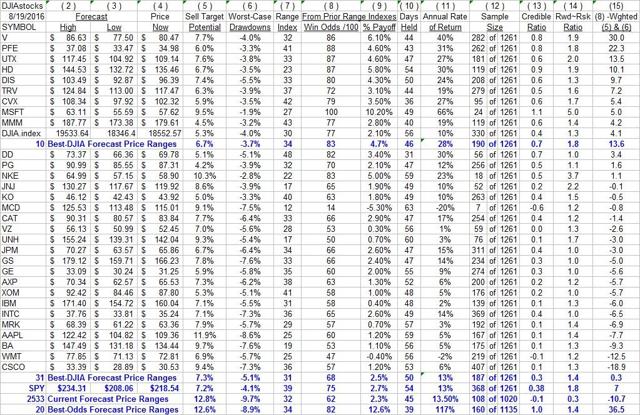
source: blockdesk.com
Columns (5) and (6) are the source for Figure 1 coordinates. The (7) metric tells what % of the (2) to (3) range lies below (4). It discriminates among (12) prior forecasts to select the similar sample from which columns (8) to (14) data is provided. (13) compares (5)’s promise to (9)’s prior delivery; (14) compares (5) to (6). (15) is a figure of merit combining the several qualitative measures into an odds-weighted, risk-conditioned number.
For this exercise we ranked the top equity interests by the (15) figure of merit.
Hmm. The ten now most attractive DJ stocks have forecasts that previously gained 4.7% of the average 6.7% upside targets expected. In 1,900 prior similar forecasts for these stocks 83% recovered from average interim price drawdowns of -3.7% at their worst points during the typical 46 market days it took to reach their targets. Compound average price growth rates (CAGRs), including losses, were at a 28% rate.
The blue rows at bottom of Figure 2 aggregate this set of 30 stocks plus their separately indicated index and its index-tracking ETF to be compared with a total population of all stocks and ETFs similarly analyzed this day. SPDR S&P500 ETF (NYSEARCA:SPY) provides an investable broader market index comparison. The Top-20 stocks aggregate indicates how the most-competitive capital-gain investment candidates in the population compare.
The ten-best DJIA stocks have slightly better historic experience of earning profits in 83% of their past forecasts like today’s, than do this day’s top 20 Best-odds Forecast stocks and ETFs at only 82%. But average net payoff of the DJIA top ten at +4.7% is little better than one third of what the top 20 won at +12.6%.
Moreover, the top 20 did actually earn what their current forecasts are offering, while the best DJIA stocks only gained about 2/3rds of what their forecasts now offer. And the population’s top 20 did it in holding periods of 39 market days instead of 46, making their CAGRs +117%, four times the +28% generated by the best of the DJIA.
Conclusion
Some of the stocks in this set provide able competition in the potential near-term capital gain contest. Clue: Look for (15) scores equal or better than half of the Top-20 average score in that column.
While the best DJIA stocks have less than half of the drawdown risk of the population’s top 20, the recovery rate from those risk exposures in both superior-ranked subsets is about the same. So the higher-performing selections from the broader population make the prospect for reward from their larger apparent risk much more satisfying to a wealth-builder.
To a risk-avoider the smaller downside exposure of the DJIA best 10 may justify the cost in capital gain forgone, assuming the future of these investments will be in the coming months like it has been in the past.
Our mission is to identify high-probability price gains in the next 3-6 months. These scores are impacted by price changes which are likely to make a difference as time progresses, perhaps making otherwise un-attractive stocks now more appealing later.
Additional disclosure: Peter Way and generations of the Way Family are long-term providers of perspective information (earlier) helping professional and [now] individual investors discriminate between wealth-building opportunities in individual stocks and ETFs. We do not manage money for others outside of the family but do provide pro bono consulting for a limited number of not-for-profit organizations.
We firmly believe investors need to maintain skin in their game by actively initiating commitment choices of capital and time investments in their personal portfolios. So our information presents for their guidance what the arguably best-informed professional investors, revealed through their own self-protective hedging actions, believe is most likely to happen to the prices of specific issues in coming weeks and months. Evidences of how such prior forecasts have worked out are routinely provided. Our website, blockdesk.com has further information.
Disclosure: I/we have no positions in any stocks mentioned, and no plans to initiate any positions within the next 72 hours.
I wrote this article myself, and it expresses my own opinions. I am not receiving compensation for it (other than from Unique Finance). I have no business relationship with any company whose stock is mentioned in this article.