Flaherty & Crumrine Preferred Income Fund: A Good Or Bad Investment?
For those of you unfamiliar with this series of articles, they’re basically an approximate five-year profit and loss review of a number of Exchange-Traded Funds (ETFs) and Closed-End Funds (CEFs) that primarily invest in and, hopefully, profit from dividends earned from their investments in preferred securities, which they then distribute to shareholders. This link will provide you the information necessary to fully appreciate and understand the following article, the differences inherent in CEFs and ETFs, and the remaining articles of this series. It will also serve to eliminate lots of reading redundancy for my regular readers.
This report concerns the Flaherty & Crumrine Preferred Income Fund (PFD), hence the following description:
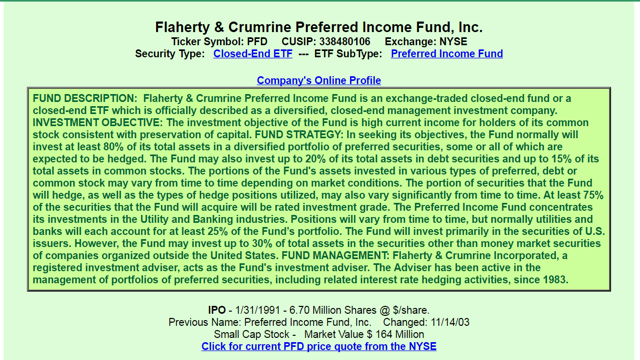
As is customary with CEFs, management fees total .84%, plus unnamed expenses of approximately 0.46%, and interest costs of leverage of .52%, all totaling 1.82%, a bit on the high side of the cost of such funds. Transaction costs include commissions when securities are bought or sold, and any applicable taxes if held in a taxable account. The more active the trading account, the higher these fees. From my research thus far, this appears to be standard operating procedure for funds such as this.
Its effective leverage is a bit high at 34.15%. The inception date of this fund was 1/31/91, at which time, its NAV was $13.95 and its inception price was $15.00/share. As I write, its share price is $16.23 and its NAV is $14.00, which translates to a premium of 13.74% However, over this past year, it has traded at an average premium of 3.91%, which indicates to me that with a little patience, you might be able to enter this fund at a reduced price.
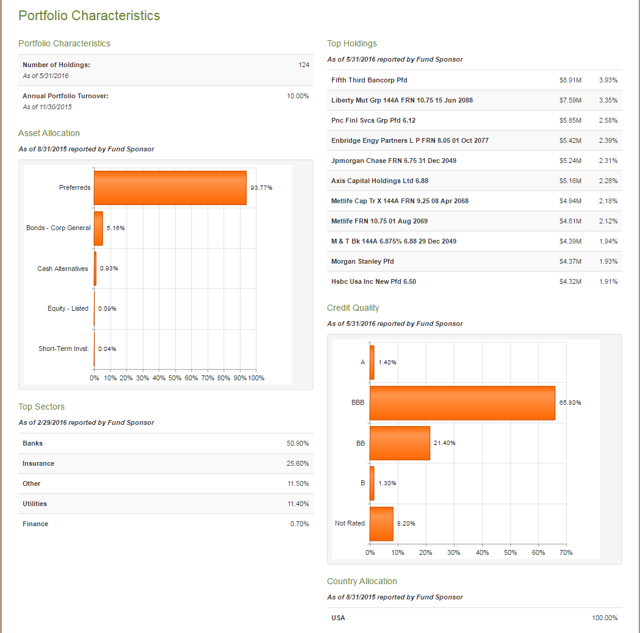
From the following list of its top 10 holdings, it’s apparent that this fund primarily invests in the preferreds of banks and insurance companies, the majority BBB, or low investment grade rated, all of which are American-based.
Now for its performance over the past five years:
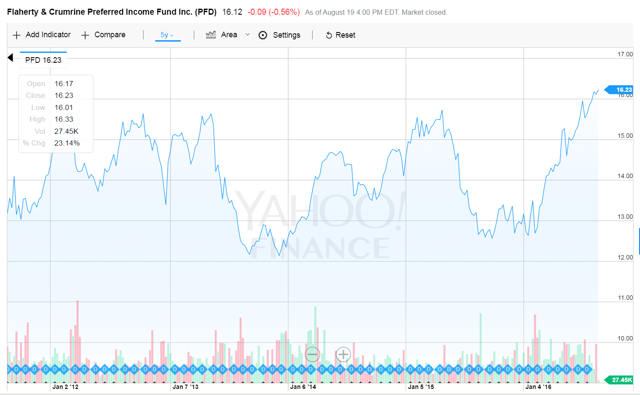
The chart displays PFD’s performance over the past five years. This fund has had its ups and downs yet has performed well during this time. Beginning on 8/22/11, it traded at $13.18 and now is currently trading at $16.23, a gain of $3.05.
PFD has distributed $5.692* for each share invested at an average price of $13.18 on 8/22/11.
*I got the dividend distribution figures from DividendInvestor.com.
- 5.692/13.18 = 43.19% yield over 5 years.
- 43.19/5 = 8.64% yield per year.
Therefore, if my math is correct, the investor would have profited by a yearly dividend yield of 8.64% over the past 5 years. However, because the price per share over the past five years has appreciated by $2.72:
- 5.692 + 3.05 = 8.742/13.18 = 66.33% over 5 years.
- 66.33/5 = 13.27% yield per year.**
** This is a simple interest calculation. At this time, I’d like to invite any follower with the knowledge and inclination to provide the compounded interest figures to step up and add it to the knowledge base in the comment section of this and any future fund review article. It would be most appreciated.
A great profit over the past 5 years. However, utilizing our DRIP calculator, a $10,000 investment over this time would now be worth $17,777.87, or a 12.18% annually compounded gain, a bit less than the unDRIPed gain, which leads me to believe that share purchases were made under adverse conditions.
For those of you interested in adding this fund to your portfolio, at $16.23, you will be buying it at a steep premium of 13.74% over its $14.00 NAV. However, you might want to wait because over the past year, this fund has traded at an average premium of 3.91%, which does not surprise me because this fund has performed well these past five years.
The following is the list of funds I have and will investigate to give you a clear picture how each has performed over the past five years. Initially, I had decided to judge each over the entire life of the fund, but was dissuaded by a number of followers who advised that the results would be unfairly skewed by the recessionary contraction of 2008-09. Here’s that list of funds, which has grown considerably as a result of additions you requested:
iShares U.S. Preferred Stock (NYSEARCA:PFF), PowerShares Preferred Portfolio ETF (NYSEARCA:PGX), Global X SuperIncome Preferred ETF (NYSEARCA:SPFF), PowerShares Financial Preferred Portfolio (NYSEARCA:PGF), VanEck Vectors Preferred Securities ex Financials (NYSEARCA:PFXF), SPDR Wells Fargo Preferred Stock ETF (NYSEARCA:PSK), PowerShares Variable Rate Preferred Portfolio (NYSEARCA:VRP), iShares International Preferred Stock ETF (NYSEARCA:IPFF), John Hancock Preferred Income Fund II (NYSE:HPF), First Trust Preferred Securities and Income ETF (NYSEARCA:FPE), Flaherty & Crumrine/Claymore Total Return Fund (NYSE:FLC), Flaherty & Crumrine/Claymore Preferred Securities Income Fund (NYSE:FFC), Flaherty & Crumrine Dynamic Preferred and Income Fund, Inc. (NYSE:DFP), Flaherty & Crumrine Preferred Income Opportunity Fund (NYSE:PFO), John Hancock Preferred Income Fund III (NYSE:HPS), Nuveen Preferred Income Opportunities Fund (NYSE:JPC), John Hancock Preferred Income Fund (NYSE:HPI), Clough Global Opportunities Fund (NYSEMKT:GLO), First Trust Strategic High Income Fund II (NYSE:FHY), First Trust High Income Long/Short Fund (FSD), Prudential Global Short Duration High Yield Fund (NYSE:GHY), ProShares UltraShort S&P 500 (NYSEARCA:SDS), First Trust Intermediate Duration Preferred & Income Fund (NYSE:FPF), Cohen & Steers Select Preferred and Income Fund, Inc. (NYSE:PSF), Virtus Global Multi-Sector Income Fund (NYSE:VGI), DNP Select Income Fund (NYSE:DNP), John Hancock Premium Dividend Fund (NYSE:PDT), Cohen & Steers Infrastructure Fund (NYSE:UTF), Flaherty & Crumrine Preferred Income Fund (NYSE:PFD), Clough Global Equity Fund (NYSEMKT:GLQ), and Clough Global Allocation Fund (NYSEMKT:GLV), Duff & Phelps Global Utility Income Fund (NYSE:DPG), Stone Harbor Emerging Markets Total Income Fund (NYSE:EDI), New America High Income Fund (NYSE:HYB), and BlackRock Utility & Infrastructure Trust (NYSE:BUI).
Below is a screenshot taken from my IB platform that I populated to keep you apprised of the order of my reviews, and as a bonus, the funds’ prices at the market close on 8/19/16.
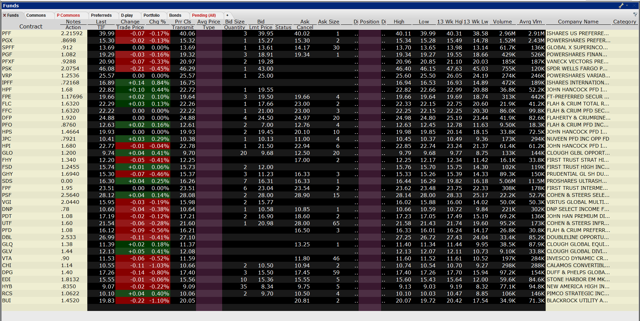
Notice, the 2015 dividends are placed just to the right of the fund symbols. To the right of that are the trade prices as indicated on the above date. Of further interest, at the far right of the screen, are the prices of the 13-week highs and lows of each fund.
One final note: My IB platform will only allow one additional fund to be added per single page view, as displayed above. Consequently, the next fund addition will be the last of this series, which when completed, meaning all the funds listed have been reviewed, I will attempt to compare and contrast them as to which I considered to be gradations of the best and worst investments over the past five years.
Disclosure: I/we have no positions in any stocks mentioned, and no plans to initiate any positions within the next 72 hours.
I wrote this article myself, and it expresses my own opinions. I am not receiving compensation for it (other than from Stock Plaza). I have no business relationship with any company whose stock is mentioned in this article.
Additional disclosure: This series of articles primarily focuses on the past five year performance of each ETF and/or CEF reviewed strictly from profit or loss perspective, which is designed as a platform, or a setting of the table, for the reader to add his or her thoughts, knowledge, and information to the conversation.