It Pays Dividends (Literally) To Invest In This Highly Predictable REIT
Last year, I decided to check under the hood of the “clean energy REIT” known as Hannon Armstrong (NYSE:HASI). Like so many new players in the REIT sector, I thought I needed to broaden my horizons and gain more knowledge of the Annapolis-based company that provides debt and equity to the efficiency, wind and solar markets.
When I started “peeling back the onion,” I became fixated on the superior credit quality of HASI’s multiple revenue streams that generate some of the most predictable sources of dividend growth.
As a leading provider of capital to the clean energy industry, HASI exists at the intersection of financial markets and energy markets. The company went public in 2013, and since that time has completed more than $2.4 billion of transactions ($935 million in 2015) with leading service providers, including a number of Global 1000 corporations and private developers.
Bloomberg New Energy Finance has estimated that approximately $500 billion of capital needs to be invested in clean energy assets in each of the next 25 years in order to ensure global temperatures rise no more than 2° Celsius.
Our research suggests that HASI, only public for 3 years, is one of the most predictable dividend growth models as the company’s pipeline for consolidation is massive – HASI provides 1/500 th of the $500 billion pipeline now. The REIT intends to be investing in clean energy assets for the long haul while continuing to learn from markets how to survive and prosper during periods of change.
The company’s stated goal is to “be the firm that rewards its investors with a sustainable yield, all the while, financing the future of energy.” The cash flows (or cost savings) generated by HASI are from proven technologies that minimize performance uncertainty, enabling the company to more accurately predict project cash flow over the term of the financing or investment.
It is this commitment to predictability that we are maintaining our BUY rating and we believe investors will be rewarded for the compounding growth projectory that will in turn lead to above average risk-adjusted returns.

Source: PredictAble – Produkter – icap.nu
Why Is Hannon Armstrong So Predictable?
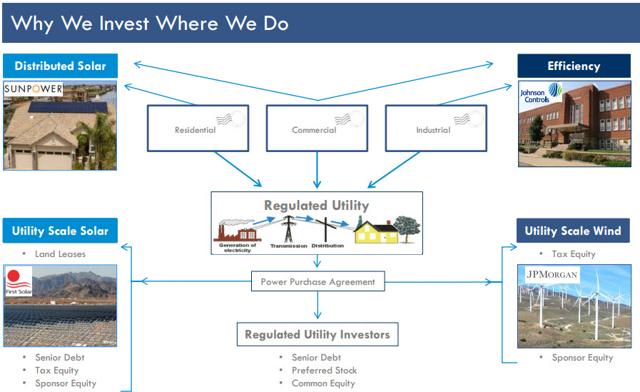
What makes HASI unique is the fact that the company aggregates assets in multiple categories, all pertaining to clean energy real estate projects. For example, it invests around 28% of its capital in energy efficiency assets, such as HVAC, Lighting, Controls, and Pumps. Needless to say, these are all considered “real estate” assets, as they are attached to either land and/or buildings that qualify as real estate.
Around 68% of HASI’s capital is deployed into renewable energy-related assets, such as solar and wind. These don’t qualify as good REIT assets, but HASI has ample “bad REIT” asset capacity to invest in plenty more renewable assets, particularly as it continues to add good REIT assets. Again, these all qualify as real estate.
A minority (around 2%) of the company’s remaining capital is invested in sustainable infrastructure that includes water and communications. It seeks the best risk-adjusted returns in target asset classes, which is most often in the senior or preferred position. In effect, HASI is senior to the regulated utility investor.
As noted above, HASI has been public for three years and have produced a total shareholder return of over 125% in that period, which is supportive of the company’s investment thesis. The company believes that it can earn better risk adjusted returns by investing on the right side of the climate change line and by making those investments in the senior or preferred equity positions of the capital stack.
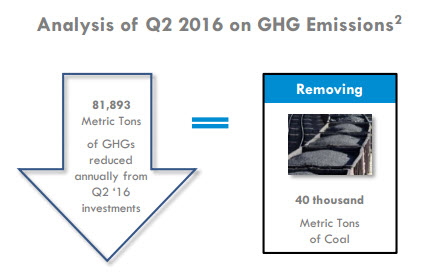
By investing on the right side of the climate change line, this means that HASI’s investments would be assets that are neutral to negative on incremental greenhouse gas emissions. In a world increasingly defined by carbon, HASI doesn’t sacrifice returns to have a positive environmental impact, but rather it expects to have better results than if the company were to ignore carbon in its investment decisions.
As HASI has done for years, it analyzes each investment for its greenhouse gas impact. And in Q2-16, the aggregate investments reduced greenhouse gasses by 81,893 metric tons equivalent to approximately 40,000 metric tons of coal.
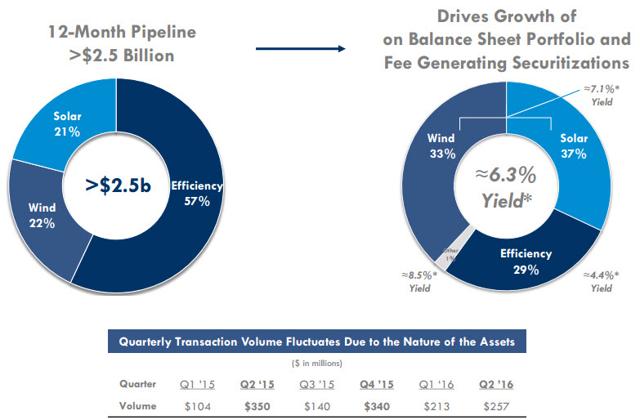
HASI’s pipeline remains at more than $2.5 billion for the next 12 months. Not all of the products will be in demand, but HASI has multiple markets and platforms available to originate new transactions.
Because renewable energy clients have unprecedented visibility on U.S. tax policy for the next 5 years, HASI is seeing new ways to participate in the wind and solar markets as these clients prepare more ambitious business plans.
As these plans are implemented over the next several years, this should lead HASI to increase the volumes of wind and solar transactions in its pipeline, which would balance out the company’s robust efficiency pipeline. See the 12-month pipeline below:
Very Predictable Drivers
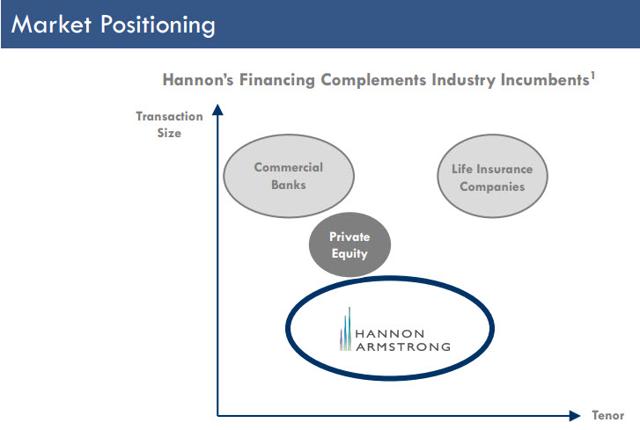
HASI is similar to a bank, and most of its investments are generally senior to another slice of capital, such as the sponsor equity. Also, the REIT benefits from the diverse portfolio of clients and projects that’s insulated from the whims of any one client, project, or asset class.
However, unlike a bank, it is positioned to maintain flexibility in deal size and tenor. Here’s a snapshot below comparing HASI’s REIT model with that of other competitors:
One of the things that make HASI’s business unique is its focus on the diversified portfolio of high credit quality assets. The company’s real estate and debt portfolio is 98% investment grade-rated, consisting of 42% of assets from government obligors and 56% commercial transactions, with only 2%, or $17 million, not considered investment grade.
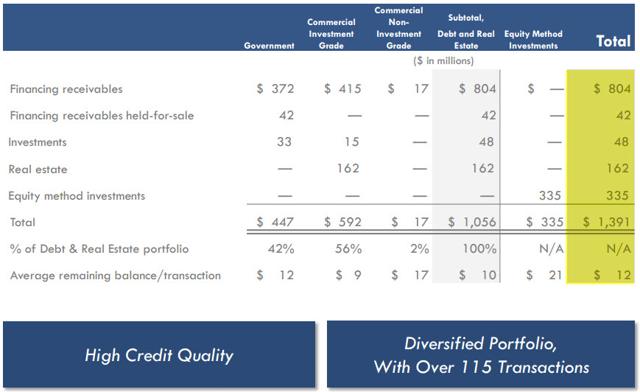
Given the nature of the wind equity investments, HASI does not include them in its analysis. The portfolio is widely diversified, with over 110 projects and an average outstanding balance of approximately $12 million per project.
As you can see below, the company has 62% of assets financed with fixed-rate debt, with the remaining consisting of floating-rate debt, equity method investments, and real estate. Also, most of the new assets are originated at current rates, which is, in effect, similar to a bond ladder.
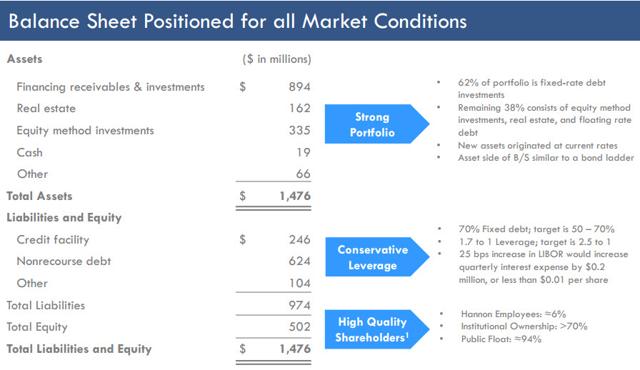
The asset side of HASI’s balance sheet is similar to a bond ladder: As referenced above, presently 62% of assets are fixed rate debt investments, with the remaining consisting of floating-rate debt, equity method, and real estate. So new assets are originated at current rates, which in fact, is similar to a bond ladder.
On the debt side, HASI has approximately 70% of the debt fixed rates, and leverage is 1.71 to 1.0 against its 2.5 to 1 leverage target, down from 2.31 last quarter as a result of the equity raise at the end of June.
As of Q2-16, HASI estimates that a 25 basis point increase in LIBOR would increase quarterly interest expense by approximately $200,000, or less than $0.01 a share (a manageable number).
HASI’s portfolio is becoming increasingly diversified with over 115 projects at an average outstanding balance of approximately $12 million per project. The company’s exposure to projects (other than the residential solar portfolio that involve YieldCos) is under 10%, and HASI does not expect any negative impact from the SunEdison bankruptcy.
The Latest Quarter Results
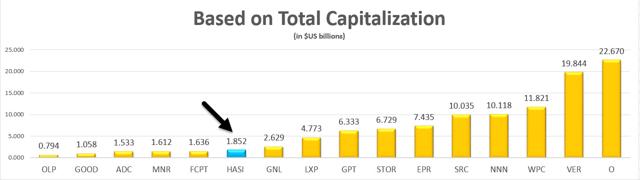
There is really no true “peer group” for HASI, and given the “bond-like” investment attributes, I have decided to compare the company to the net lease and healthcare REIT sectors.
Source: S&P Global Market Intelligence
Keep in mind, though, while I’m comparing HASI’s dividend yield with that of other net lease REITs, it’s really not an “apples to apples” relationship.
Remember that the company utilizes core earnings (instead of FFO) because it’s more appropriate to add back non-cash charges (does not depreciate operating expenses). So, when evaluating the financial performance for this company, the best metric is core earnings per share. Let’s take a look at HASI’s EPS history:
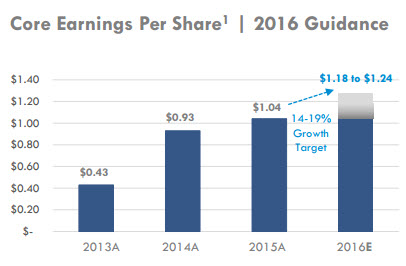
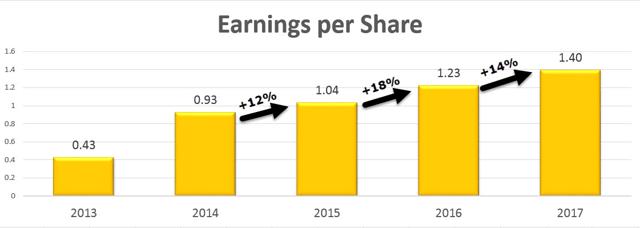
In Q2-16, HASI announced core earnings of $0.32 per share, a 23% increase from Q2-15. Also in Q2-16, HASI closed $257 million of transactions, down from $350 million in the second quarter of last year; however, the company is still ahead of last year’s pace (for the first half of 2016). As you can see (above), HASI has guided core EPS at $1.18 to $1.24 for 2016, and we have modeled the growth for 2017 as well:
Source: S&P Global Market Intelligence
As you can see below, HASI has maintained a very reliable and predictable dividend history:
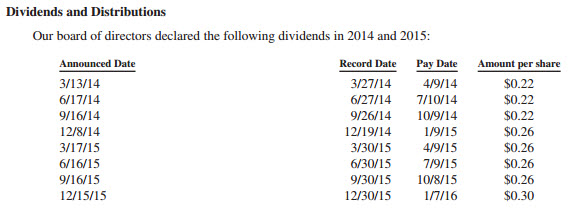
Here’s a snapshot of the dividend growth history:
Source: S&P Global Market Intelligence
With over three years of history as a REIT, it’s becoming increasingly easier for analysts to understand HASI’s unique business model. While there are certainly nuances (like P/E versus P/FFO), I am warming up to the reliability of the company’s dividend growth record and more importantly, its most predictable dividend growth model.
So What Is This Predictable REIT Worth?
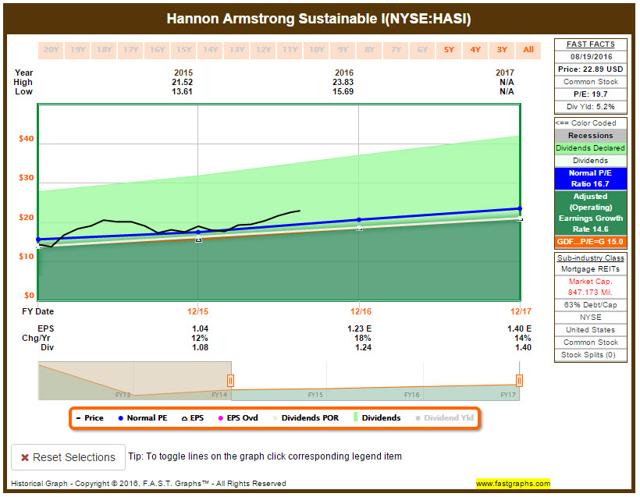
HASI’s $0.30 dividend produces a 5.2% annualized yield and is generated from a mix of clean energy assets, principally efficiency, wind, and solar. Keep in mind, HASI pays out 100% of earnings, yet it is a high-growth stock, and the earnings history validates that argument.
Also, as noted, it does not have the Capex costs that the net lease REITs have, so the REIT pays out virtually 100% of its income (and over the last 2 years, over 60% of HASI’s dividends have been treated as return of capital due to available tax attributes from income for taxable REIT subsidiary).
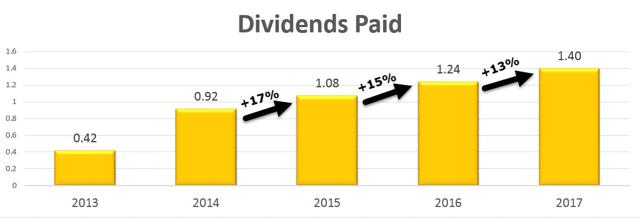
As you can see above, HASI increased its dividend by double digits every year, and now we can see a trend in which the company has boosted its dividend. So now let’s measure the company based on the following metrics, starting with dividend yield:
Source: S&P Global Market Intelligence
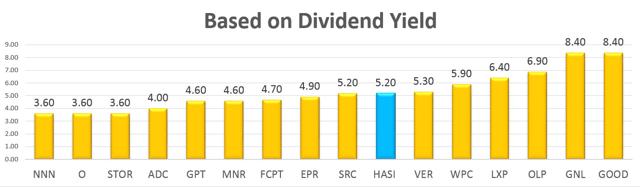
As you can see, HASI is in the middle of the broad net lease peer group, but it’s interesting to see the following chart:
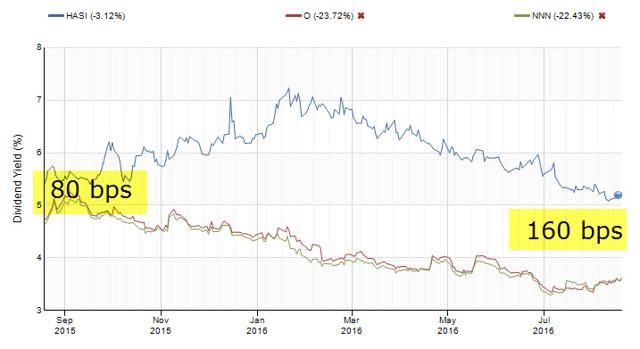
Source: S&P Global Market Intelligence
What the above chart illustrates is that HASI’s dividend yield is now 160 bps wider than the stalwart REITs, Realty Income (NYSE:O) and National Retail (NYSE:NNN). While the market has bid up the prices for many Net Lease REITs, HASI remains a soundly values stock today. Let’s now examine P/FFO (as noted, I used P/E for HASI):
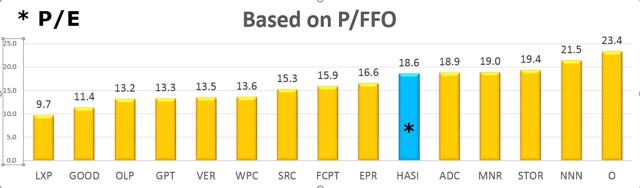
Source: S&P Global Market Intelligence
Again, this metric is not really an “apples-to-apples” approach, but it does provide us with some indication that HASI is not as expensive as O and NNN. Also, the price does not necessarily reflect the predictable cash flows being generated by HASI.
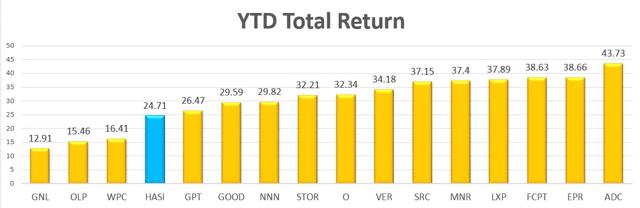
As far as I’m concerned, HASI looks more like a utility company than a REIT. My attraction with utility stocks is related to the sustainable attributes that make the defensive asset class virtually recession proof and I feel as though HASI has some of the same attributes that help me “sleep well at night.” Keep in mind, HASI has not become part of the Net Lease feeding frenzy since January 1st:
Source: S&P Global Market Intelligence
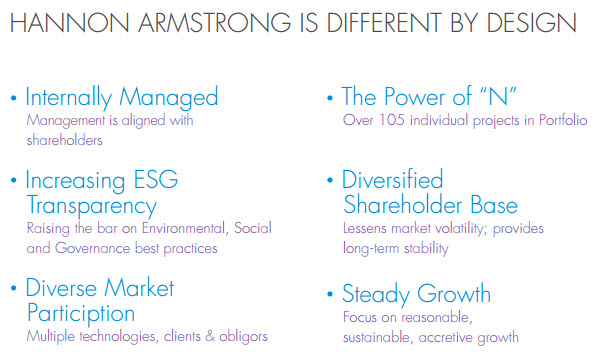
In conclusion, HASI is “different by design.” This REIT is uniquely positioned to continue to generate steady dividend growth. We continue to believe that the predictability of profits is the most powerful differentiator.
Our BUY recommendation is predicated on HASI’s fundamentals. and we believe that investing in energy will pay predictable dividends.
Author’s Note: Brad Thomas is a Wall Street writer, and that means he is not always right with his predictions or recommendations. That also applies to his grammar. Please excuse any typos, and I assure you that he will do his best to correct any errors if they are overlooked.
Finally, this article is free, and the sole purpose for writing it is to assist with research (Thomas is the editor of a newsletter, Forbes Real Estate Investor), while also providing a forum for second-level thinking. If you have not followed him, please take 5 seconds and click his name above (top of the page).
Sources: FAST Graphs, HASI Investor Presentation/Q2 Supplemental, and S&P Global Market Intelligence.
Disclaimer: This article is intended to provide information to interested parties. As I have no knowledge of individual investor circumstances, goals and/or portfolio concentration or diversification, readers are expected to complete their own due diligence before purchasing any stocks mentioned or recommended.
Disclosure: I am/we are long O, DLR, VTR, HTA , STAG, GPT, ROIC, HCN, OHI, LXP, KIM, WPC, DOC, EXR, MYCC, TCO, SKT, UBA, STWD, CONE, BRX, CLDT, HST, APTS, FPI, CORR, NHI, CCP, CTRE, WPG, KRG, SNR, LADR, PEB, BXMT, IRM, CIO, LTC.
I wrote this article myself, and it expresses my own opinions. I am not receiving compensation for it (other than from Unique Finance). I have no business relationship with any company whose stock is mentioned in this article.