Powerball ETF Lottery Tickets, Or
Compare These Reward~Risk Tradeoffs with 3 Weeks Ago
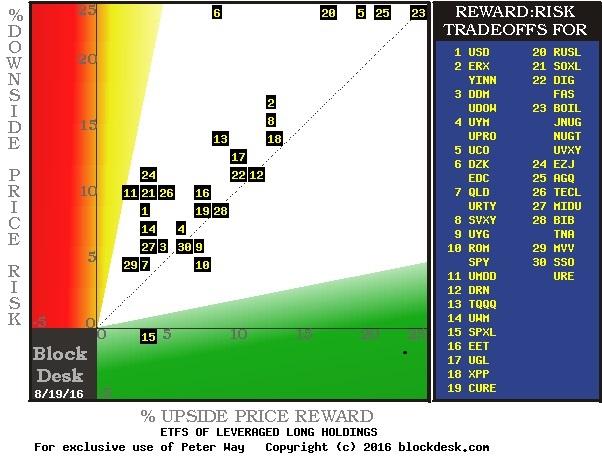
Figure 1
(used with permission)
Each stock is positioned in this map by its intersection of upside price change forecast on the green horizontal scale and the price drawdown exposures (on the red vertical scale) typical after prior forecasts like today’s. Any issue above the dotted diagonal has more potential risk than return at its present price.
Since price-change risk is a dynamic, not a constant, in time these exposure relationships will change. But right now there are opportunities for gains as well. What else might create trouble? Let’s look at how these forecasts have been derived.
We have a special way of looking at stocks and ETFs
If you have seen this explanation before, please jump to the next bold-faced headline.
Technology advances in communications and information have transformed the way securities markets operate, and the way major investors behave as a result. Prices of equities now normally gyrate during one-year elapsed periods in ranges that are typically multiples of the underlier’s trend growth.
Which means that during part of the year period their prices are retreating, and are consuming investments of time which cause the “growth” trend rates to be far less than what their better progress periods provide.
Advances in information technology encourage investment professionals (the market-making [MM] community) to protect the capital they must put at risk to do their jobs. Those actions cause the markets for equities and derivatives to become more integrated than they were in much of the 20th century.
So we study what the Pros’ behavior causes to happen in the price-change “insurance” derivatives markets, to understand just how far it is reasonable to believe specific stock and ETF prices may move, both up and down, in the next few months.
This analysis has been conducted without material change daily for over a decade on more than 2500 widely-held and actively-traded stocks and ETFs. The resulting price range forecasts provide an actuarial history (unmatched elsewhere in the investment community) of subsequent market prices, as testimony to the strength or weakness of the forecasts made earlier.
Near-term price gains are most important to investors who are now either starting out in building a portfolio’s wealth and exploring how it may best be done, or to investors who have come to realize that plans made years earlier are unlikely to be met at current rates of investment wealth accumulation.
Active investing, where capital is constantly put to work in the best odds-on situations to deliver profit within foreseeable time horizons, is the strategy most likely to produce what is needed, at least risk. But active investing needs guidance as to what to do, when to do it, and with what intensity.
What’s going on in the Market for Stocks Now?
At this point in time these ETFs are wobbly canaries in the stock market coal mine. The perceptions of market professionals see over three-quarters of ETFs with leveraged long holdings as having larger price drawdown exposures than upside gain prospects.
They see less than a third of those ultra-price-sensitive ETFs as having credible upside prospects. Only five out of those 40+ ETFs have a combination of credible upside forecasts larger than their downside risks.
The market “Music Man” would say: “Folks, you got trouble. Right here in Investment City. Trouble begins with T and that rhymes with P and that stands for Prices.”
Can 76 (or some number) of the “right stocks” bring calm and prosperity back to our beloved neighborhood? Or are there some big-payoff lottery-ticket ETFs out there that could set the joint jumpin’?
Go back to Figure 1 and check out its extremes in the following table, Figure 2.
Each row of that table contains, first the current hedging-derived price range forecast for the symbol indicated. Then, for that security are dimensions of investment interest drawn from all prior forecasts of the past 5 years which had upside to downside proportions like the Range Index shown in column (7).
We compare equity investments this way because long experience shows that each security develops an individual market persona. By selecting all prior dates when each stock had expectations with similar proportions to the way they are now being considered, comparisons can be made between issues that would otherwise not be seen as proper equals.
Figure 2
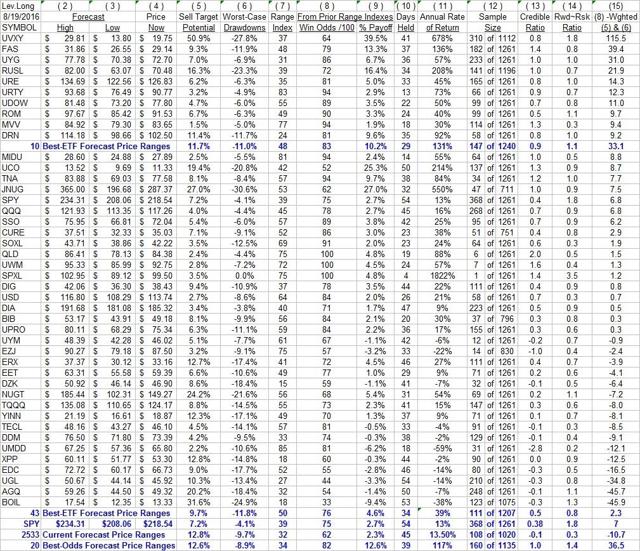
Source: blockdesk.com
Columns (5) and (6) are the source for Figure 1 coordinates. The (7) metric tells what % of the (2) to (3) range lies below (4). It discriminates among (12) prior forecasts to select the similar sample from which columns (8) to (14) data is provided. (13) compares (5)’s promise to (9)’s prior delivery; (14) compares (5) to (6). (15) is a figure of merit combining the several qualitative measures into an odds-weighted, risk-conditioned number.
For this exercise we ranked the top equity interests by the (15) figure of merit, as we do when normally looking for good value, reasonable reward vs. risk prospects.
Observations
But position extremes on the Figure 1 map are much more interesting now.
Take the Direxion Daily S&P500 Bull 3X ETF (NYSEARCA:SPXL) at position [15] of Figure 1. On Figure 2 it is about midway between the blue average lines of 10 best and 43 best. It offers an upside price gain of +3.5%, with 0.0% price drawdown (riskless?).
Although it has a Range Index of 75 (three times as much downside in prospect as up) its prior experience has seen no decline from original cost in the average holding period of 4 market days, since there has been only one prior experience at this level of Range Index.
That produced a +4.8% gain (100% of the times) which, if it could be compounded 91 times in a year, would generate a CAGR of +1822%. Common sense suggests rejection when looking at such extremes.
Now jump up to the upper right corner of Figure 1, where the powerball lottery ticket ETFs are concentrated, multiples of them, located at [23].
There we find the ProShares Ultra VIX 2X Short-Term Futures ETF (NYSEARCA:UVXY), which is ranked at the top of Figure 2. Its position is not due to its strong balance of upside to downside prospects; a 37 RI indicates about twice as much upside as down. Nor is it a big odds-on winner – 64 out of 100 is close to only 2 out of 3, or losses a third or more of the time.
No its ranking attractiveness is due to its volatility potential, an upside gain prospect of possibly +50% or a bit more. The time cherry on top of that treat is that on average it has been accomplished in only 41 market days, about 8 weeks, so that it could be compounded some 6+ times in a year’s worth of holding periods. That has happened in 310 days out of the last 5 years, hardly a rare occurrence.
But the pickle in the treat is that -28% losses have pulled the rewards actually realized, net of losses, down from +50% to “only” +40%, or a CAGR of 678% (the power in the powerball ETF lottery).
Other big-winner candidates are the Gold Miners Bull 3X ETF (NYSEARCA:NUGT), the junior-class gold miners’ version of NUGT from the Direxion Daily Junior Gold Miners Index Bull 3x Shares ETF (NYSEARCA:JNUG), and the ProShares Ultra Bloomberg Natural Gas 2X ETF (NYSEARCA:BOIL). They each have a natural resource base, although the gold-based ones depend on financial system panic, while BOIL must have some presumption of a link with crude oil price recovery.
Conclusion
We aren’t forecasting any lasting market disaster. But the lack of enthusiasm for further price gains in so many leveraged-long ETFs is a statement of sorts that some kind of market scare is increasing as a possibility. If it should come, some ETFs could pay off big.
While anything out at the margins of reality might occur long enough to get off a trade capturing a speculatively-taken position profit, the experiences with BOIL at its present RI suggesting 7 times as much upside as down have proved to work out only 1/3rd of the time. The other 2/3rds have been at losses approaching -10% or CAGRs of -38%. This seems like a very risky long-shot deserving rejection.
The potential for a serious systemic failure of world banking and currency systems is now widely and endlessly discussed. For gold prices rising sufficiently to justify some of the ETF prices, it appears there might need to be total dissatisfaction with the acceptance of any existing currency, and gold becoming the only medium of exchange.
This hardly seems likely. More likely is that the US dollar will continue to become the more preferred (least risky) store of value. For US investors keeping score in dollars, there is little to no profit in such conversion. For other world-based investors there may be some opportunity if the crisis appears real and lasting. But if gold is being priced in the decision in terms of US dollars the “benefit” is like that of a US investor. Priced in Dinars or other local currency, the trade is really just a FX (foreign exchange) trade.
The better long-shot (not already saturation-priced) may be UVXY, from some market over-valuation reaction via a spike up in the currently low VIX index. But be warned, the profit opportunity window in time terms may be quite short, and there is no good way to guess how big it might get.
It just has a history of recurring as +40% payoffs 310 times out of 1261, or one quarter of a 5-year’s days, and having a cycle of one sixth of a year. Frequency and duration may be on your side when properly timed. It has only had a couple of such moves in the last 6 months to a year.
But it could fail to appear soon enough to make the investment in time a disappointment, due to the brevity in size and profitable holding period creating a missed opportunity.
This is not investing, it’s just shopping for excitement. But some folks do it, maybe need it.
Disclosure: I/we have no positions in any stocks mentioned, and no plans to initiate any positions within the next 72 hours.
I wrote this article myself, and it expresses my own opinions. I am not receiving compensation for it (other than from Unique Finance). I have no business relationship with any company whose stock is mentioned in this article.