Retirement Income: 10 Taxable, Fixed-Income, Closed-End Funds From PIMCO
PIMCO operates in something of a special niche in the closed-end fund universe. No closed-end fund sponsor has so many funds priced at such high premium valuations. Consider this: PIMCO offers 20 closed-end funds (nine tax-free municipal bond funds and 11 taxable funds). Six of these (30%) have premiums exceeding 20%. One reaches 106% and another hits 50%. At the other end of the valuation scale, there are only three PIMCO CEFs priced at a discount and two of those have discounts that fail to cross even -1% below NAV. Observers have been predicting the demise of those high-premium funds for as long as I’ve been following closed-end funds. But despite occasional drops in their premiums those valuations have proven to be remarkably stable. By no means is it my point to sing the praises of high premiums, merely to point out PIMCO’s near-unique position for fixed-income CEF investors.
With this article I be starting a short series on PIMCO CEFs, focusing on the ten funds that comprise the taxable, fixed-income cohort.
These are:
- PIMCO Dynamic Credit Income Fund (NYSE:PCI)
- PCM Fund Inc. (NYSE:PCM)
- PIMCO Corporate & Income Strategy Fund (NYSE:PCN)
- PIMCO Dynamic Income Fund (NYSE:PDI)
- PIMCO Income Strategy Fund (NYSE:PFL)
- PIMCO Income Strategy Fund II (NYSE:PFN)
- PIMCO High Income Fund (NYSE:PHK)
- PIMCO Income Opportunity Fund (NYSE:PKO)
- PIMCO Corporate & Income Opportunity Fund (NYSE:PTY)
- PIMCO Strategic Income Fund (NYSE:RCS)
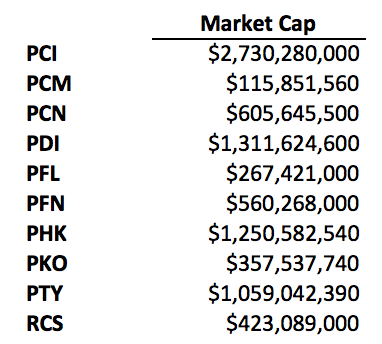
The sizes of these funds range from the quite small PCM ($116M) to PCI ($2,730M), the largest fixed-income CEF.
Portfolios
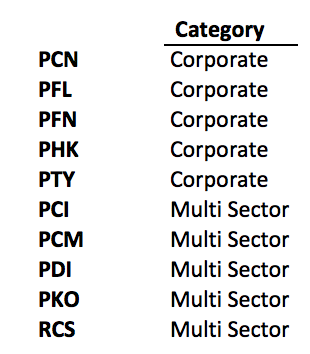
PIMCO lists the categories for these funds as being multi-sector or corporate.
It’s not as clear as that categorization might appear, however. I’ve pulled two major components of the portfolios from Morningstar, corporate bonds and securitized credit, to give a somewhat more granular picture of how the funds are alike and differ. I’ve further broken down the securitized cohort into residential and commercial non-agency mortgage-backed, and other securitized loans.
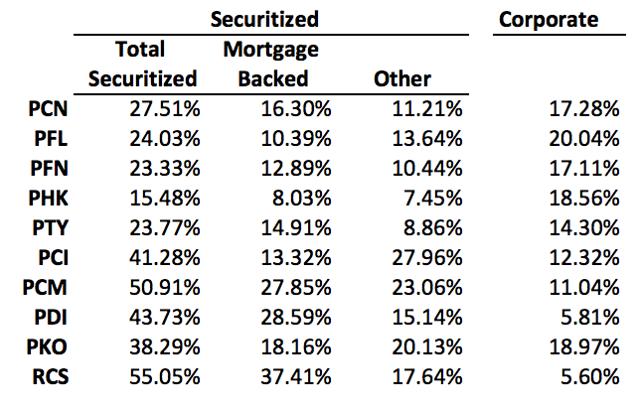
As we see, the multi-sector funds are more heavily invested in mortgage securities, although the commitment here is down substantially from a year ago (This Best-Of-Class CEF Has An Historically Deep Discount And Exceptional Yield) when PDI held 67% in the category. As an aside, PDI’s investment strategy is to “normally invest at least 25% of its total assets in privately issued (commonly known as ‘non-agency’ mortgage-related securities….”
Morningstar’s summary lists the bond holding of the funds as follows.
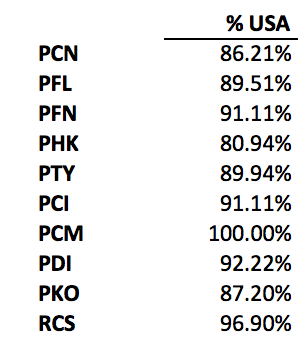
For the most part the remaining percentage are from western developed countries, mainly Luxembourg, Netherlands, Bermuda, Ireland and France. A few funds hold bonds from Latin America (Brazil, Paraguay and Costa Rica) but in no case does this component comprise more than 2% of the funds’ total bond holdings.
Premiums and Discounts
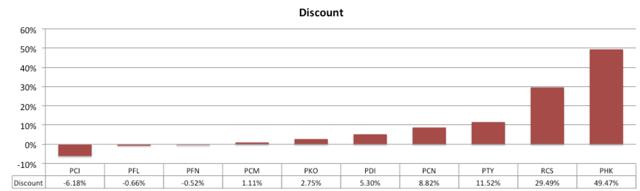
As I noted in the introduction, discounts are scare. Only one fund has a discount deeper than -1% that being PCI at -6.18%. Seven are priced at a premium valuation.
To put these Premium/Discount values in perspective here are 3 and 12 month Z-Scores.
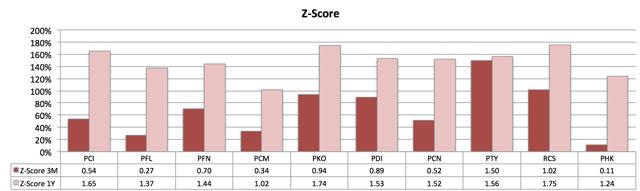
You’ll note that for every fund the trend is strongly toward premiums over the mean values for the time periods. All ten are at least one standard deviation above the one-year average value. Everyone who follows closed-end funds will be aware that this situation reflects the trend across the investment category. By the end of 2015, CEFs had fallen to exceptionally deep discounts but since the beginning of this year those discounts have either disappeared completely or have been slashed deeply. PIMCO closed-end funds consistently demand higher valuations than the typical CEFs, so it’s not surprising to see this situation. Will investors continue to bid up the high yields from CEFs or, at least, will their pursuit of yield sustain these valuations into the future? Those are key questions for any buyers in today’s CEF market place.
For a look at the trends in discount-premiums for these funds I’ve pulled out the 12-month pattern for some representative funds (from cefconnect.com, where the interested reader can go for those I’ve omitted that might be of interest).
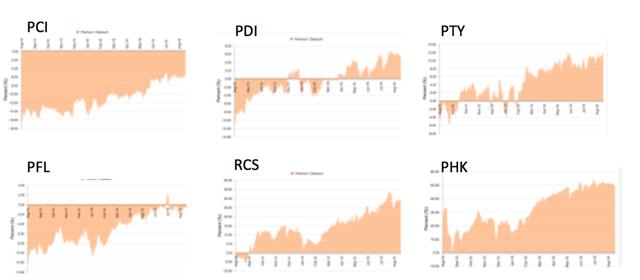
As we see, funds that had been discounted a year ago either saw those discounts shrink substantially (PCI, PFL) or turn to premiums (PDI, PTY). Funds that have historically run a high premium had dropped to more accessible levels at this time last year, but have now returned to their high premium status (RCS, PHK).
So, while three funds do have a discount, albeit very slight in two cases, none shows the sort of trend one might look for in a well valued CEF.
Distribution Yields
Distribution yields on NAV range from a low of 9.28% to a high of 18.73% . After those premiums take their toll, this range compresses to market price distribution rates from 8.61% to 12.53% . The discount on PCI takes its market distribution rate to 9.89%, which is above the median of 9.7% for the full set.
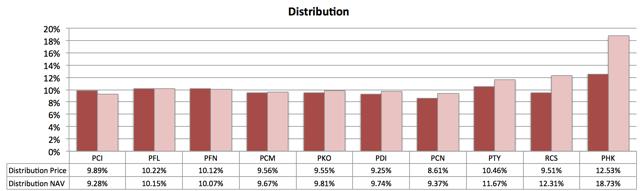
As is typical of CEFs within a given category, premium-discount status correlates with NAV distribution as buyers bid up the higher yielding funds.
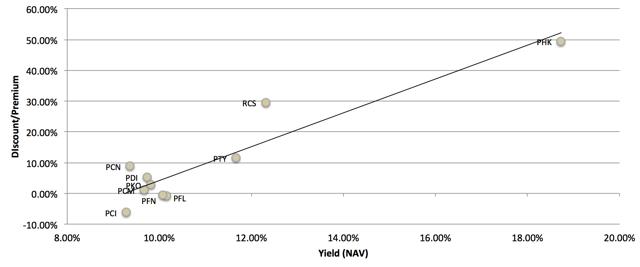
This chart points to PCI, PFN and PFL as funds that could merit further consideration for all but the most aggressive yield hounds. I will add, however, that if one considers reversion to mean valuations to be an important consideration in predicting future direction for premium-discount movements, none of the funds are particularly well positioned in that regard (see Z-scores above).
An important consideration in valuing distribution yield has to be the prospects for yield sustainability. Alpha Gen Capital recently discussed PIMCO most recent report on distribution coverage which is worth repeating here. This table is taken from PIMCO’s July report on investment income.
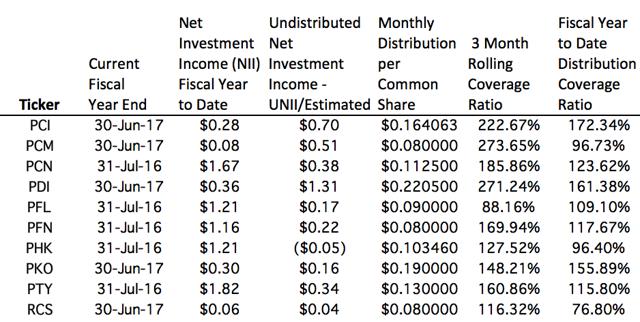
Some of these data, those for funds whose fiscal year ended in June, are only indicative of one-month’s returns; the rest cover the full fiscal year. For this reason, the rolling three-month coverage values may be a better comparator. You’ll notice that PCI, PCM, PDI all have rolling three-month coverage ratios above 200%. This bodes well for a year-end special distribution for these funds. When special distributions are added the relative position of funds in the distribution spectrum can change dramatically. Last year PDI’s special distribution made it PIMCO’s best yielding fund in the category, making it a strong bargain compared to the lower-yielding high-premium funds. But special distributions are unpredictable and tend to be ignored by CEF buyers. I will discuss the important role of special distributions in subsequent articles in this series as I get into the individual funds.
NAV Returns
Just as yield on NAV is the key to how a fund is earning its distribution, total return on NAV is a key metric for understanding a fund’s true performance. Total return on market price is useful for those already owning a given fund, but because it incorporates the wide fluctuations in premium-discount status we saw above, it is a poor metric for deciding how well fund management is performing.
Total returns on NAV and price for the past year are shown in this chart.
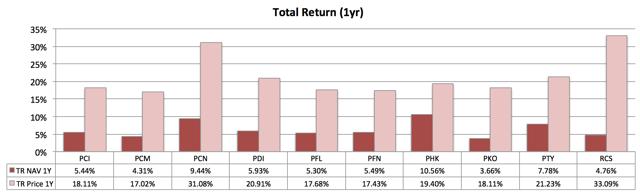
PHK, PTY and PCN are standout performers on a NAV total return basis. RCS, despite its strong showing on a market price basis falls into the lowest third of the group. With its high premium and mediocre NAV performance, RCS would look to be a fund to sell, something I pointed out a few weeks ago (Retirement Income: It’s Time To Sell This PIMCO CEF).
PCN in addition to having had a strong year at NAV, turned in an excellent return at market price as well. There’d be a lot to like here were it not for the nearly 9% premium one would have to pay to buy the fund, which pulls its 9.37% NAV yield down to 8.61% at market.
Summary
PIMCO’s fixed-income funds continue to do well. Unfortunately for a new buyer, their strong performances most often come with large to very large premiums. PCI stands alone as a fund with an appealing discount. PCI has struggled over the years in comparison to its somewhat older sibling, PDI, but it has been a consistently high yielder. Indeed, its present yield of 9.89% is a bit on the low side for its recent history. PCI is the first fund I’d single out for a close look for someone interested in buying a PIMCO CEF. Two other funds that are well valued, at least relative to the rest of the line up here, are PFL and PFN. As I continue this series I will be looking in detail at each of these three as well as some of the other strong performers in the group.
Disclosure: I am/we are long PCI, PDI.
I wrote this article myself, and it expresses my own opinions. I am not receiving compensation for it (other than from Unique Finance). I have no business relationship with any company whose stock is mentioned in this article.
Additional disclosure: I have no ties to the financial or security industries in any form. My interests are strictly personal. The banker part of the nym has absolutely no relationship to the profession of the same name. Readers should be aware that I am an investing novice. I do not give advice; what I publish is an annotated version of my research notebook. Anyone who finds any securities to be of interest will necessarily want to do his or her complete research and due diligence before acting on that interest. It would be foolish to rely on my conclusions without having done so.