Ventas: Wait For The Valuation To Cool Down
Ventas (NYSE:VTR) is a real estate investment trust with a highly diversified portfolio of seniors housing and healthcare properties located throughout the United States, Canada and the United Kingdom. They are part of the “Big 3” in healthcare REITs (including Welltower (NYSE:HCN), HCP Inc (NYSE:HCP) and VTR). Lately I’ve been following this sector more closely because most companies in this sector are stable income producers, have a solid business model and great demographic trends ahead of them. Let’s take a look at Ventas and discuss whether it can be a good addition to your portfolio at current prices!
Quick historic overview
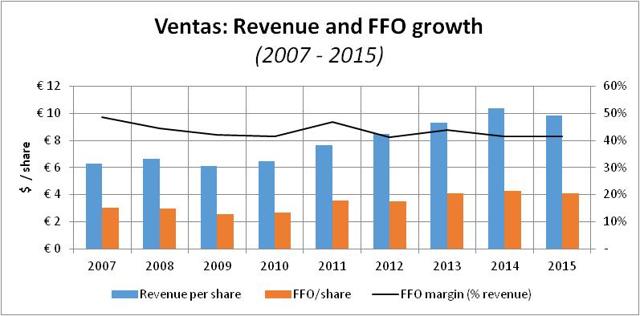
Before I delve into the current situation and valuation of Ventas, let’s see how they have performed during the last years. The figure below shows the revenue and FFO growth in the period since 2007.
Source: graph made by author, data from various annual reports
Revenue per share grew around 6% per year and FFO by slightly less than 4%. Furthermore we can see that the FFO margin (% of revenue) remained stable between 40-50%. FFO growth of 4% per year for a decade is nothing to sneeze at. Together with a dividend yield of 5% and reinvestment of those dividends you are looking at +10% total returns.
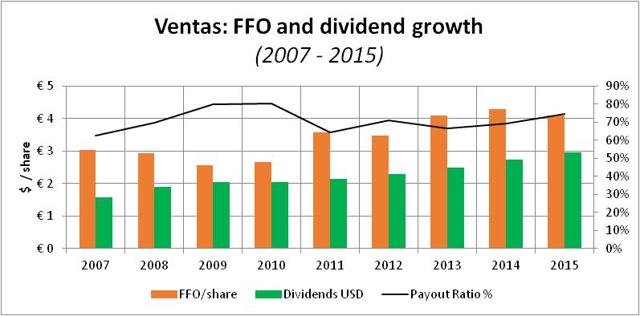
Source: graph made by author, data from various annual reports
The dividend is covered by the funds from operations. The payout ratio hovers between 60-80% and currently stands at around 74%, slightly above the historical average. From these graphs I can see Ventas has a stable and solid business model and performed accordingly in the last decade. But how does their current portfolio look like and what is their strategy moving forward?
Current portfolio
They own approximately 1,300 properties, consisting of seniors housing communities, medical office buildings (“MOBs”), skilled nursing facilities, specialty hospitals and general acute care hospitals. In the graph below I’ve provided a breakdown of their portfolio based on the investment amount and the net operating income.
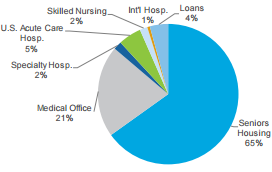
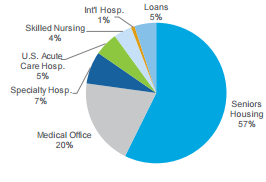
(Source: Q2 2016 quarterly supplemental information)
From the graph we can see that seniors housing is the biggest part of its portfolio. The seniors housing market continues to perform well and attract substantial investor interest creating a very competitive investment landscape. Medical offices provide around 20% of their net operating income.
Portfolio strategy
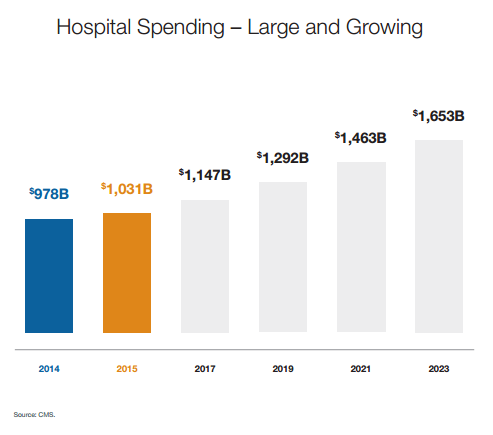
In 2015 Ventas acquired the real estate network of Ardent Health Services, a top-ten U.S. hospital provider, for roughly $1.3 billion. According to executive management it’s “a beachhead investment in the massive hospital space which adds a powerful channel for new growth”. The graph below shows that hospital spending is expected to grow at around 6% per year in the coming decade. Of course this growth will also include real estate expenditures.
Finally, Ventas completed the spinoff of most of their post-acute/skilled nursing facility portfolio into an independent, pure-play SNF REIT named Care Capital Properties (NYSE:CCP).
In 2016 VTR acquired two MOBs and one triple-net leased seniors housing asset for approximately $42.0 million. They’ve also made a $140.0 million secured mezzanine loan investment with an annual interest rate of 9.95% relating to properties in California and Massachusetts.
Furthermore, VTR announced that they agreed to acquire university-affiliated life sciences and medical real estate assets of Wexford for $1.5 billion in cash. This acquisition will add 23 operating properties, two development assets and nine future development sites. This transaction is expected to be completed in Q4 this year. Estimates show that the acquisition is accretive to the tune of $0.07 – $0.09 per share.
I mentioned the acquisition of Ardent Health Services earlier and that it provides a new channel of growth. The Wexford acquisition is similar in this regard, because it strengthens VTR’s relationships with leading universities, academic medical centers and research companies and offers new possibilities in this space. The life science market is a $50 billion healthcare real estate pie divided among a few big players (Alexandria Real Estate (NYSE:ARE), BioMed Realty (NYSE:BMR), HCP) and a lot of smaller players. This acquisition could prove to be a stepping stone for VTR in this market.
To finalize this section about portfolio strategy and future growth potential, I also look at their biggest segment, seniors housing. The table below shows that the population growth, and especially the 75+ population growth, in a 3-mile radius around senior housing communities is expected to grow significantly in the next few years. This demographic trend is a definite tailwind for the company.
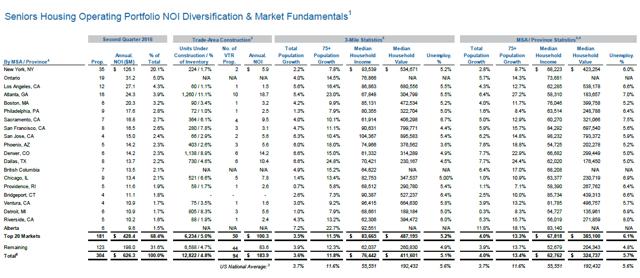 Source: Q2 2016 quarterly supplemental information)
To summarize VTR’s portfolio strategy, they are disposing of assets such as SNF’s and using the funds to invest in newer platforms such as the hospital space and the life sciences and university space.
Contractual revenue maturities
The figure below provides an overview of the expected contractual revenue maturities.
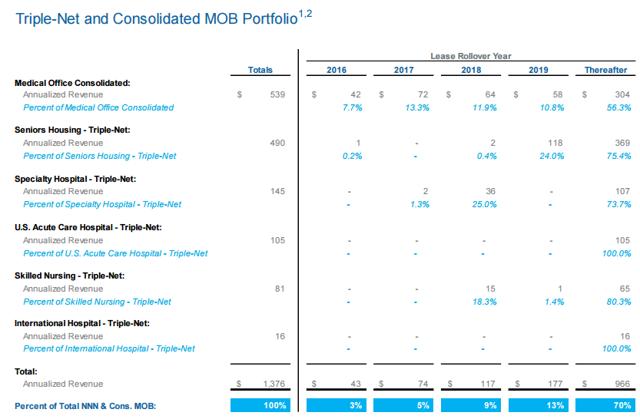
Source: 2016 Q2 supplemental information
In the coming few years around 30% of contractual revenue expires in the triple net and medical offices portfolio. It is slightly more than I would normally want but it’s hardly problematic. VTR still has enough time to renew the real estate agreements with their customers.
Debt
Total outstanding debt is around $11 billion of which 85% is fixed rate debt. Earlier this year Ventas refinanced $450 million of 1.55% senior notes due September 2016 by issuing $400 million of 3.125% senior notes due 2023. The weighted average rate for fixed debt is 3.9% and for variable rate debt 1.6%. Total cost of debt is 3.5%. Cheap capital is one of the reasons that VTR (and other REITs) are performing nicely.
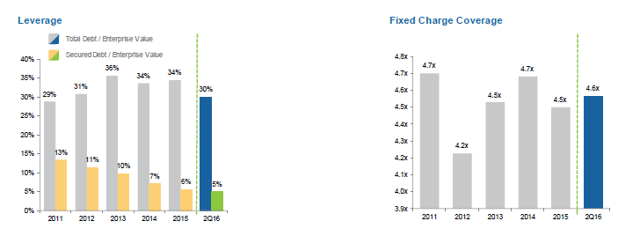
Source: 2016 Q2 supplemental information
Ventas is not overly leveraged, especially based on historical norms. For every dollar of debt there are more than two dollars of equity. The fixed charge coverage ratio is nearing the highest point in the last few years.
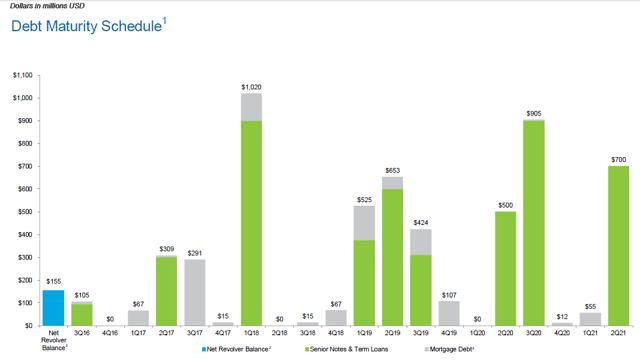
Source: 2016 Q2 supplemental information
The debt maturity schedule is well laddered. The peak in Q1 2018 consists of a combination of a $700 million senior note, a $200 million unsecured term loan and around $120 million in mortgage debt. The rate on that particular senior debt tranche is 2%. I suspect they will refinance this debt soon in the current low interest rate environment.
Valuation
So far the financial overview and portfolio strategy showed me that Ventas is a solid business which knows what they are doing. However that does not immediately mean that an investment in Ventas at this point offers a good risk-return. Of course, that depends on the price. In order to assess the value of Ventas I’ve used two valuing approaches: a FFO multiple and a Net Asset Value estimation.
FFO multiple
In the graph below, I plotted the stock price range for each quarter as a blue range on the left Y-axis. On the right Y-axis, I have plotted the low and high P/AFFO multiples for each quarter:
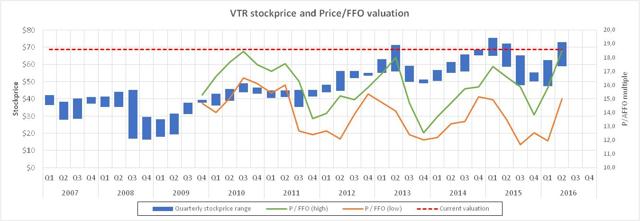
Source: created by author
The average price-to-FFO ratio is somewhere between the 14-16x multiple. Currently the Price-to-FFO multiple is almost 19x. It seems like Ventas is 20% overvalued based on the historical situation. A price of $58 provides a 15x FFO multiple entry point. The dividend yield would be somewhere around 5%.
Net Asset Value model
The Net Asset Value (NYSE:NAV) is the cash value that represents the value an investor would receive if a company is broken up today. This means that all the assets will be sold at market value and liabilities will be paid. The remaining cash is distributed among shareholders in order to estimate the NAV.
The biggest asset Ventas owns is its real estate portfolio.
|
Type of property |
Ventas Gross Investment |
Annualized net income |
cap rate |
Market Value |
Difference with book value |
|
Seniors Housing |
16,101 |
1,116 |
6.5% |
17,169 |
+ 1,068 |
|
Medical Office |
5,220 |
387 |
6.5% |
5,954 |
+ 734 |
|
Specialty hospitals |
469 |
145 |
12.0% |
1,208 |
+ 739 |
|
US acute care Hospitals |
1,311 |
105 |
10.0% |
1,050 |
– 261 |
|
Skilled nursing |
439 |
81 |
10.0% |
810 |
+ 371 |
|
International hospitals |
146 |
16 |
12.0% |
133 |
– 13 |
|
Total |
23,686 |
1,850 |
26,325 |
+ 2,639 |
Source: table by author (amounts in million $)
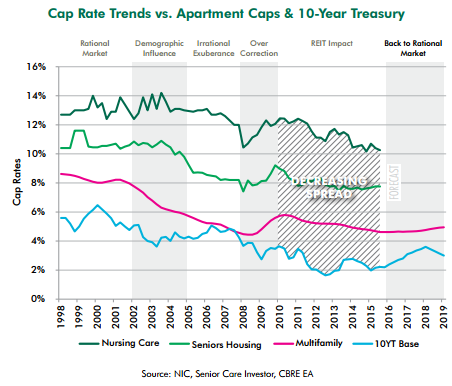
The biggest contributor to annualized net income is obviously the seniors housing segment. Ventas invested over $16 billion in seniors housing real estate that earns somewhere around $1.1 billion each year. In the last two decades cap rates for seniors housing has declined from around 10% to under 8% nowadays. Recent portfolio additions by other REITs (Sabre Health Care (OTCPK:SABA) and HCN) suggest a slightly lower cap rate. I expect cap rates to remain stable or even slightly lower because of the influx of cheap capital. If we assume that cap rates are currently around 6.5% for this segment, it means that the current income stream from seniors housing is worth over $17 billion.
The graph below provides a historic overview of the cap rate for medical office buildings.
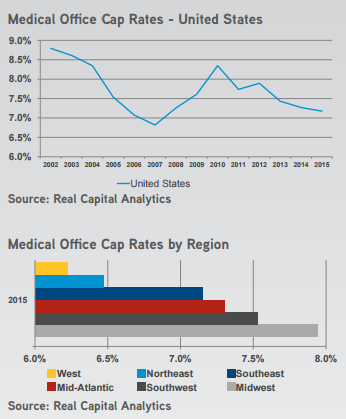
Based on VTR’s last few transactions in this space, and from fellow REIT Physicians Realty Trust (NYSE:DOC), I’ve assumed a cap rate of 6.5% for much of the same reasons I noted earlier. The cap rates of other segments are less important for the calculation the net asset value because the income these assets produce is less than 20% of total NOI. I’ve assumed somewhat higher cap rates between 10-12%.
The total market value of VTR’s portfolio is over $26 billion. Together with $1 billion in secured loans and around $800 million in other assets (cash, assets held for sale) this results in total assets of $28.2 billion. I have excluded goodwill from the balance sheet ($1 billion) because it does not provide any value to other investors. Liabilities consists of mostly long-term debt ($10.9 billion).
|
Net Asset Value |
Amount |
|
Market value of real estate assets |
$ 26.3 |
|
Secured loans |
$ 1.0 |
|
Other assets |
$ 0.8 |
|
Total assets |
$ 28.2 |
|
Senior notes payable and other debt |
$ 10.9 |
|
Other liabilities |
$ 1.2 |
|
Redeemable OP unitholder and noncontrolling interests |
$ 0.2 |
|
Total liabilities |
$ 12.3 |
|
Net Asset Value |
$ 15.9 |
|
Number of outstanding shares |
342,571 |
|
NAV / share |
$ 46 per share |
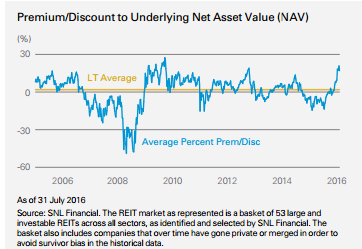
The Net Asset Value of VTR is almost $16 billion. Divided over the outstanding shares this results in a NAV/share of $46. This represents a premium of 58% over the current price of $73. A recent report of SNL Financial suggests that the REIT sector on average trades at a premium of around 20%. Historically this the sector’s long-term premium averages 2-3%.
Of course the NAV method is not perfect. It can understate the value of intangible assets (such as goodwill) and does not take into account future changes (up or down) in revenue or income. The outcome is driven by the assumed cap rates. The value of an individual asset may vary significantly whether it is valued on a going concern or break-up basis. However, even if accept a premium of 20%, that results in a price of around $56. That means that shares are overvalued by almost 25%.
Both the valuation methods that I used suggest VTR is overvalued 20 to 25%. A buy zone of $56 – $58 seems reasonable.
Total return expectation
Total return is driven by earnings growth, dividends and valuation (multiples compression/expansion). To calculate the expected total return for the coming 5 years, I’ve assumed FFO growth of 4% (in line with historical FFO growth) and a slightly higher dividend growth (5%). The FFO multiple in 5 years is thought to be the historical average of 15x. The simplified cash flow schedule looks as follows.
|
Year |
0 |
1 |
2 |
3 |
4 |
5 |
|
FFO ($) |
$ 3.93 |
$ 4.09 |
$ 4.25 |
$ 4.42 |
$ 4.60 |
$ 4.78 |
|
Price-to-FFO-multiple |
18.6x |
15x |
||||
|
Investment ($) |
– $ 73 |
+$72 |
||||
|
Dividends ($) |
$ 3.07 |
$ 3.22 |
$ 3.38 |
$ 3.55 |
$ 3.73 |
|
|
Net cash flow ($) |
– $ 73 |
$ 3.07 |
$ 3.22 |
$ 3.38 |
$ 3.55 |
$ 75.45 |
The IRR of this cash flow schedule is 4.3%. This means that at the current price we can’t expect double digits return. There is hardly any margin of safety if something goes wrong (lower FFO growth, lower exit multiple). However, if we use the buy zone of $56-58 we can expect total returns of around 10% (without dividend reinvestment).
Conclusion
Ventas is a solid and well run company, with a stable business model. History has shown that an investment in its common shares have produced total returns of more than 10%. During the last year Ventas changed its portfolio strategy to focus more on the hospital markets and the life sciences, universities and research markets. I expect the investments in these segments will produce solid returns in the future. However, the current valuation is just too high for me to justify an investment in Ventas. If the share price would decrease to $56-58 I would definitely back up the truck and open a position.
Disclosure: I/we have no positions in any stocks mentioned, and no plans to initiate any positions within the next 72 hours.
I wrote this article myself, and it expresses my own opinions. I am not receiving compensation for it (other than from Unique Finance). I have no business relationship with any company whose stock is mentioned in this article.