Energy Recap: Rig Count Falls, A New Oil Production Chart To Consider
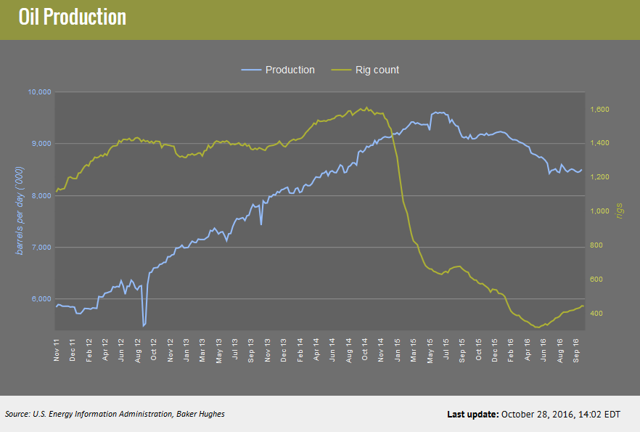
Welcome to the latest edition of the Energy Recap. This week, we’re sharing an oil production chart that displays the latest available figures for weekly U.S. crude oil output and the total number of oil rigs. The chart is dated from November 2011 through today.
(-) 
Energy Articles of Note
” Bakken Update: Contributing To The Oil Glut With A 31% Production Increase And EURs Of 875 MBOE ” By Michael Filloon
” Crude Oil – Herding Cats As Reality Sets In ” By Andrew Hecht
” Cliffs Natural Resources ( CLF ): Don’t Panic ” By Vladimir Zernov
Energy Sector Bankruptcies for the Week Ended Oct. 28, 2016
Here’s a list of the most recent bankruptcy announcements in the energy sector:
– Key Energy (KEG) filed for Chapter 11 bankruptcy on Monday, Oct. 24.
We also wanted to note that after the close on Friday, Oct. 21, Midstates Petroleum ( MPO ) announced that it has emerged from Chapter 11 bankruptcy protection.
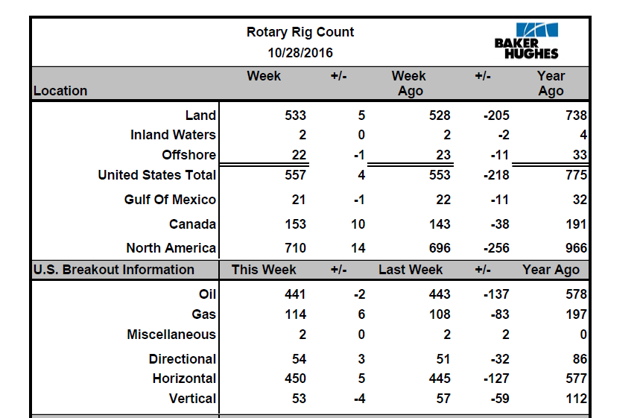
U.S. Oil Rig Count
As per Baker Hughes , the number of active U.S. oil drilling rigs fell for the first time since June.
(-) 
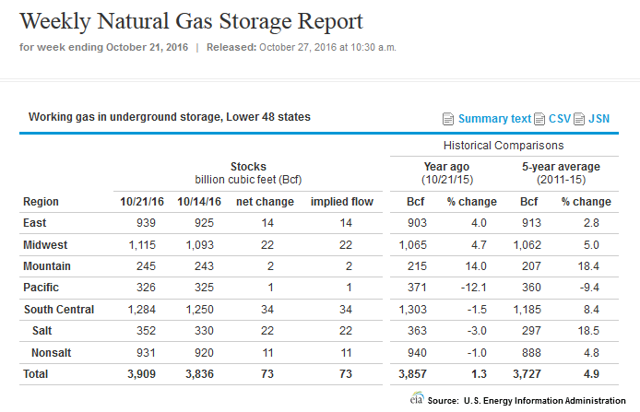
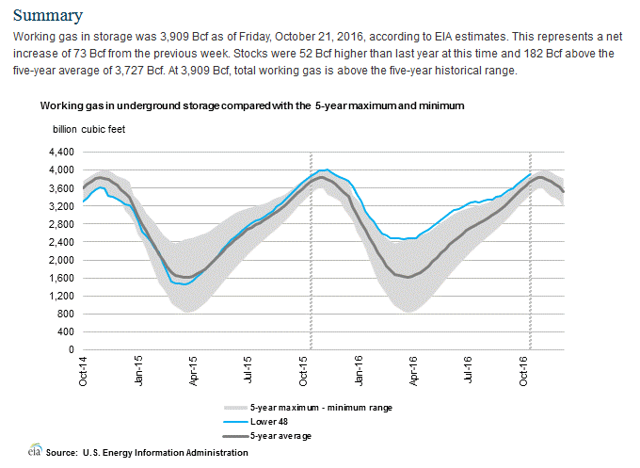
Weekly Natural Gas Storage Report and Summary
(-) 
(-) 
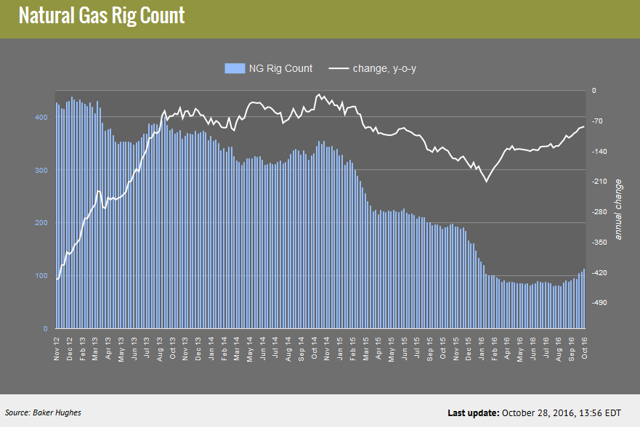
Natural Gas Rig Count
(-) 
As always, we encourage you to submit your own article by clicking here , if you haven’t already done so.
See also Amazon Pulls Back, Prime Enters China; Uber’s Self-Flying Vehicles – Eye On Tech on uniquefinance.org