'Member 3.5% Mortgages? 'Member Low-Priced Stocks? I 'Member!
Assume for the moment that the corporate profit recession is finally over. In addition, presuppose that the earnings per share (( EPS )) growth rate for S&P 500 companies will approximate its median rate (11%) over the coming year. Moreover, imagine that a forward P/E of 17.0 represents “fair value” for stocks in an era of ultra-low interest rates. (Note: The 35-year average is approximately 13.0).
Now let’s check data from S&P Dow Jones Indices. The 12-month estimate of operating earnings for the S&P 500 comes in at $126.61. Current EPS? $101.74. Earnings per share would need to grow at a 24.4% clip over the next 12 months – or more than 2x the median rate of growth – to maintain a forward P/E of 17.23 at an S&P 500 reading of 2,182.
How much more challenging would it be to achieve current analyst projections if we used the Generally Accepted Accounting Principles (GAAP). The 12-month estimate of GAAP-based reported earnings for the S&P 500 clocks in at $118.40. EPS at the present time? $89.41. Earnings per share would need to grow at a 32.4% pace over the next 12 months – or nearly 3x the median rate of growth – to maintain a forward P/E of 18.43 with the S&P 500 trading near these levels.
Wait. There’s more. It has been well documented that analysts routinely reduce expectations by 10% over the course of any given year. In other words, even Wall Street does not expect EPS to grow 24.4% or 32.2% over the next four quarters.
If all proceeds according to plan, then adulterated operating earnings could hit $106.56 at this time next year. What is the forward P/E in this instance? 20.5. Relative to the 35-year historical average for forward P/E ratios (13.0), earnings per share can grow at the rapid clip that analysts currently anticipate, and share prices would still be overvalued by a bearish 37.5%.
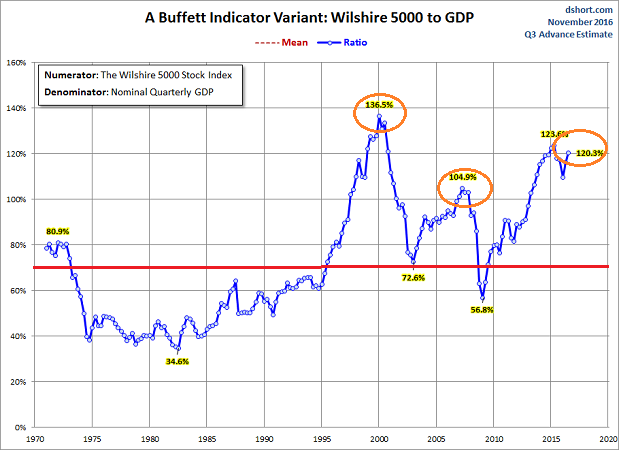
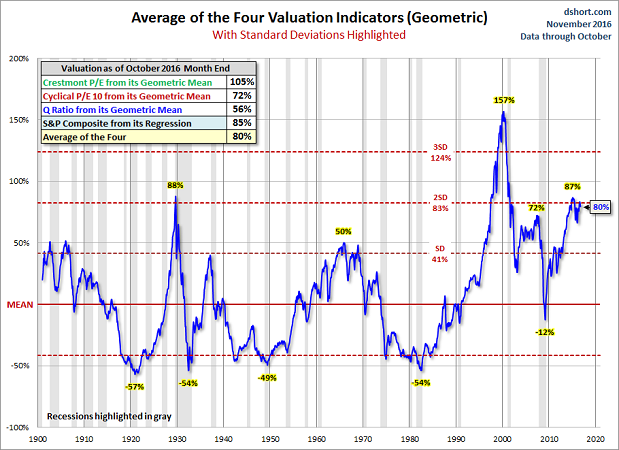
Obviously, P/E ratios are not the only way to value stocks. They may not even be the most appropriate way to value them. That said, there are scores of different valuation metrics that suggest stocks are extremely pricey. Are they all wrong? In addition to disdain for trailing PEs, forward PEs, and CAPE ratios, should household net worth to GDP, margin debt, price-to-sales, price to book, market-cap to GDP and Tobin’s q be disregarded as well?
Keep in mind, best laid plans do not always come to fruition. Pro-growth economic policies on the domestic front from the Trump team may come at the expense of significantly more government debt. That may constrain future spending . Similarly, legislation may aid some industries while damaging others. There’s also the likelihood that companies with significant revenue from overseas operations could struggle. In other words, there’s only so much companies can do to improve the bottom line when there are as many headwinds as tailwinds.
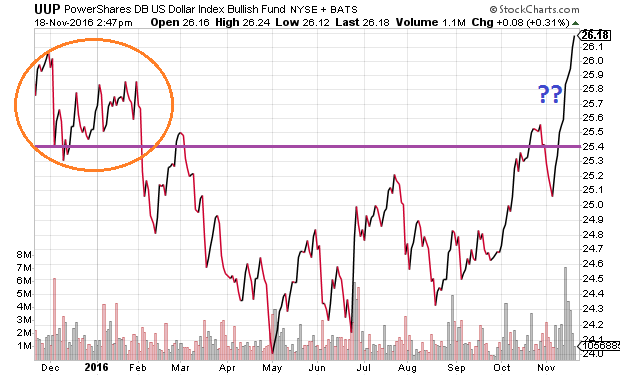
For instance, it may be desirable to bring manufacturing back to the United States. Yet the dollar’s 13-plus-year high presents a challenge for export-minded businesses. Moreover, the greenback’s sustained elevation last winter, which came on the heels of the Fed’s decision to raise overnight lending rates 0.25%, played a super-sized role in the worst single month in U.S. stock market history (1/2016). It wasn’t until the Fed removed its four-rate hike pledge from the 2016 table before the dollar declined and stocks recovered from a vicious corrective phase.
There are other obstacles as well. Remember stock buybacks? The $500 billion annually that has gone into the repurchasing of shares as well as the manipulation of earnings results? That practice has stretched the capacity for corporations to continue distributing more to shareholders than what they bring in during any given fiscal year. In particular, companies do not tend to pay out more in dividends and share buybacks than what they earn for two years in a row. And it has never taken place three years in a row.
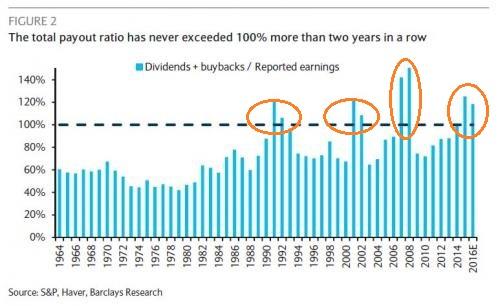
Consider the graph on the total payout ratio above. The ratio (dividends plus buybacks/corporate earnings) surpassed 100% for two consecutive years in conjunction with the early 1990s bear market, the 2000-2002 dot-com fiasco as well as the 2008 financial crisis.
Does the fact that the total payout ratio exceeded 100% in 2015 and 2016 guarantee an imminent stock market downturn? No. Nevertheless, corporations are unlikely to keep plowing revenue and borrowed dollars back into share buybacks and dividends for a third year (2017). This financial probability is an obvious headwind to bullish price appreciation.
Lastly, until now, ever-declining mortgage rates have pushed home prices higher. The lower borrowing costs have provided consumers with more discretionary dollars to spend. Now? Prospective homebuyers may be less willing or less able to make higher payments. And should they stretch to do so, they will have less discretionary dollars to spend. It should not be lost on anyone that, since the post-election yield spike, the total volume on mortgage applications plummeted 9.2% on a seasonally adjusted basis.
Bottom line? Since the election, there has been a great deal of speculation about how phenomenally well U.S. stocks will do under a Trump administration. The way I see it? A shift in the political landscape – even a monumental shift like the one that is currently being scrutinized – cannot supersede paying a reasonable price for the shares of growing companies.
Disclosure : Gary Gordon, MS, CFP is the president of Pacific Park Financial, Inc., a Registered Investment Adviser with the SEC. Gary Gordon, Pacific Park Financial, Inc., and/or its clients may hold positions in the ETFs, mutual funds, and/or any investment asset mentioned above. The commentary does not constitute individualized investment advice. The opinions offered herein are not personalized recommendations to buy, sell or hold securities. At times, issuers of exchange-traded products compensate Pacific Park Financial, Inc. or its subsidiaries for advertising at the ETF Expert web site. ETF Expert content is created independently of any advertising relationships.
See also Single-Family, Multifamily Housing Starts Soar To Highest Level In 9 Years on uniquefinance.org