Prospect Capital: Declining Distributable Income
This article is a follow up to “Upcoming Dividend Cuts For BDCs: Part 3” linked below that discussed upcoming dividend coverage for Prospect Capital (NASDAQ:PSEC). However, this article focuses on distributable income (rather than GAAP income) from its collateralized loan obligations (“CLOs”) that has been declining and over the last two quarters and GAAP NII has exceeded taxable income. Please see the articles linked below that analyze dividend coverage for PSEC, Medley Capital (NYSE:MCC) and Ares Capital (NASDAQ:ARCC). As predicted in Part 1 of this series, MCC cut its quarterly dividend to $0.22, which was just below my expected range of $0.23 to $0.25.
Links to previous dividend coverage articles:
- Introduction (includes link to survey)
- Expected Q2 2016 Dividend Coverage
- Part 1: Medley Capital
- Part 2: Ares Capital
- Part 3: Prospect Capital
As mentioned in the articles linked above, I have noticed very little discussion on Unique Finance of projected dividend coverage, especially beyond looking at historical and maybe 90 days out. Most of these projections do not provide investors with a long enough timeframe for proper dividend sustainability analysis.
Recent Dividend Coverage:
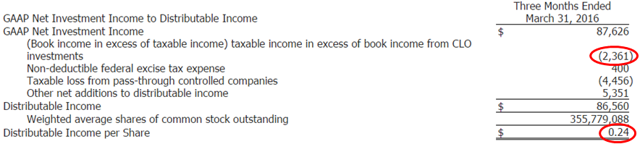
For the quarter ended March 31, 2016, PSEC came in slightly below my “base case” projections mostly due to sales and repayments during the quarter of $164 million, resulting in net investment exits of around $140 million. Dividend coverage for the quarter was supported with a one-time dividend payment from Echelon Aviation for $7.3 million or almost $0.02 per share. Distributable income was $0.24 and just short of covering the dividend. I do not consider small coverage shortfalls to be a cause for concern but if they are continual and/or growing, it will likely result in net asset value (“NAV”) per share erosion that impacts many things, including the ability to borrow capital.
Declining Distributable Income from CLOs:
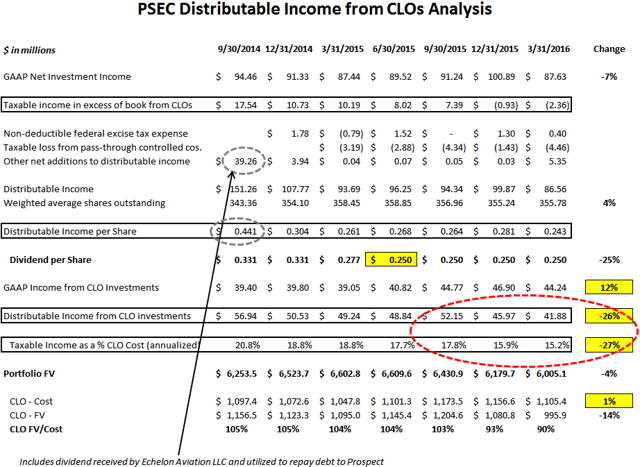
After the dividen reduction, I upgraded PSEC to a “Tier 2” dividend coverage business development company (“BDC”) implying that the current dividend is stable. Please see “PSEC Articles” for details. PSEC has been experiencing declining distributable income from its CLO investments, especially over the last two quarters as shown in the table below. When PSEC reduced its dividend in 2015, the distributable income was above its GAAP net investment income (“NII”) and the dividend. During the most recent quarter, distributable income fell below the level of GAAP NII and the dividend.
The following table uses the line items from the previous table to breakdown the amount of CLO distributable income per share.
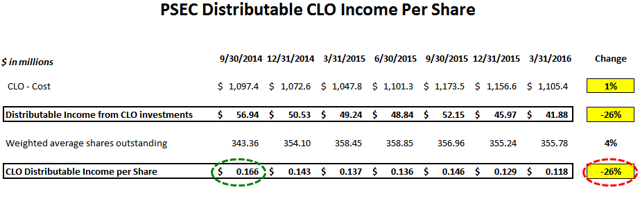
It is important to note that the amount of CLO investments has not changed much over the last six quarters but the amount of distributable income has declined by 26%, most of which is in the last two quarters.
Let’s Talk LIBOR:
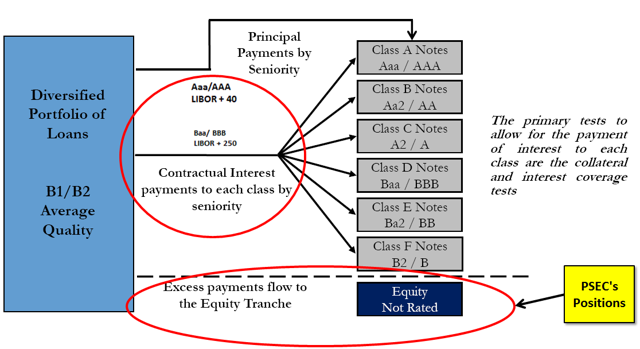
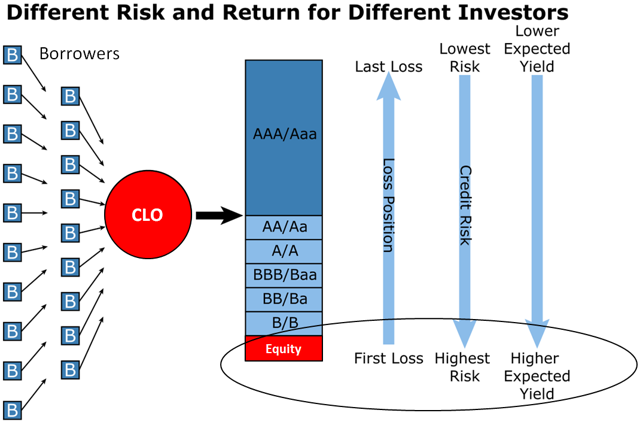
CLOs are highly leveraged investments and typically have 10x leverage. PSEC invest in the equity portion of these vehicles, which is last in line when it comes to cash flow and capital preservation as shown in the chart below (as well as the chart at the end of the article). The leveraged used in CLOs usually has LIBOR based variable rates with no floors, which means that when rates rise, so does the cost of leverage and there is less “residual cash flows” to the equity holders.
CLO equity investments have had huge returns mostly due to historically low interest and default rates.
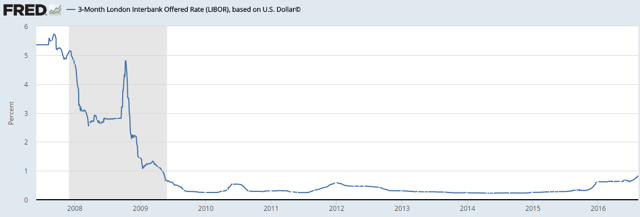
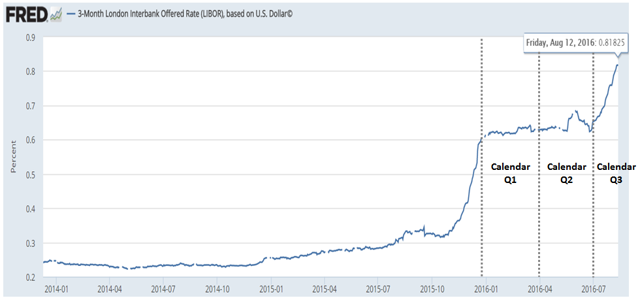
However, LIBOR has been rising in 2016 especially for calendar Q3 as shown in the chart below. I believe that this is partially responsible for the lower cash flows paid to CLO equity holders and will likely have a larger impact for the quarter ended September 30, 2016.
Other Potential Issues:
There are many factors that drive income for CLO equity investors including interest rates, deleveraging during amortization periods, reinvestments at lower or higher yields, credit quality and defaults. Assumptions for each of these factors are used when assessing GAAP income as well as valuations and easily deserve an entire article. Most higher quality BDCs are positioning their portfolios for later stage credit cycle related issues including higher defaults that were at historical lows but starting to rise as discussed in “Junk bond default rate continues to climb” and this “Forbes article” last week. I am expecting default rates to rise through the end of the year and staying away from junk bond and CLO type investments as well as BDCs that invest lower credit quality and/or syndicated assets. For more information on BDC rankings (risk, return, pricing, dividend potential), dividend coverage tiers, fee structures, historical total returns, charts and valuations, interest rate discussion, my historical purchases and current positions, and suggested BDC portfolios, please see “Index to Free BDC Research”.
Personal note: I have updated my positions to reflect changes in my holdings, but please keep in mind that some of the positions are very small and mostly for research purposes.
Disclosure: I am/we are long ABDC, AINV, ARCC, BKCC, FDUS, FSC, FSFR, FSIC, GAIN, GARS, GBDC, GLAD, GSBD, HCAP, HTGC, MAIN, MCC, MRCC, NMFC, PFLT, PNNT, PSEC, SLRC, SUNS, TCAP, TCPC, TPVG, TSLX.
I wrote this article myself, and it expresses my own opinions. I am not receiving compensation for it (other than from Unique Finance). I have no business relationship with any company whose stock is mentioned in this article.