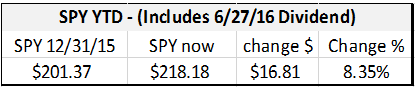
SPY Pulls Back From Record High As Market Sentiment Declines Further
In my July 7th, 2016 sentiment article I wrote, “It appears recent 4% & 6% declines may have been enough for another rally to a new high.” That decline for SPY was enough for sentiment to “reset” for an advance to record highs on August 11, 2016 for three of the four major US markets for the first time since December 31, 1999. Two trading days later, on August 15, 2016, the Dow, S&P500 and Nasdaq again closed at record highs.
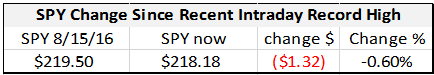
Currently, SPY adjusted for dividends is up 8.35% YTD and is only 0.6% below its record high intraday price.
SPY Dividend History here
The time to buy stocks is when there is “blood in the streets” while others are fearful and selling. In late August through early September of 2015, my investor sentiment charts were screaming BUY and I added to many positions during this time. I took profits as the market rose into the end of the year.
The markets fell again in early 2016 with SPY and the S&P500 testing their 2015 lows while the Russell 2000 and Nasdaq went even lower. I added again to positions. Then as the markets and my stocks recovered, I took profits.
I take profits after my stocks go up after buying opportunities. I also collect dividends so I have cash to put back into the markets when my stocks go down again and sentiment charts suggest it is time to buy again.
TABLE 1: Current Market Levels Compared with Benchmarks
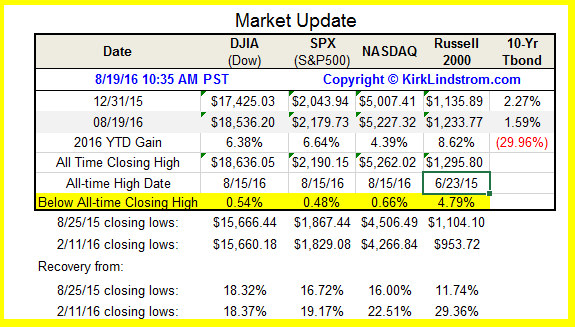
On 2/11/16, on an intraday basis the S&P500 was down 14.4% from its record high. Today it is up 18.4% from that low! Thus the period around 2/11/16 was a great time to buy!
Chart 1: S&P500 Price & Yield ($SPX & !YLDSPX) with SPY Over Time 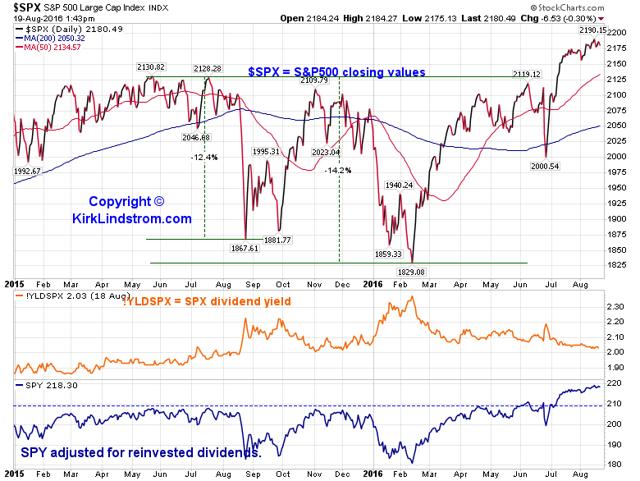
On Feb. 11, 2016 in “With SPY Down 14% Again, Sentiment Charts Suggest Another Tradable Low” and SPY at $182.20 before adjusting for dividends, I wrote “now I believe we are in another good time to add to positions.” I added to my positions during the decline. Here is my “Market Update” from that article showing all four major markets intraday were below the 8/25/15 low:
TABLE 2: Market Levels Compared with Benchmarks for the Feb. 11, 2016 Low
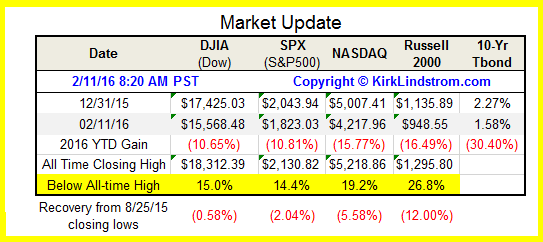
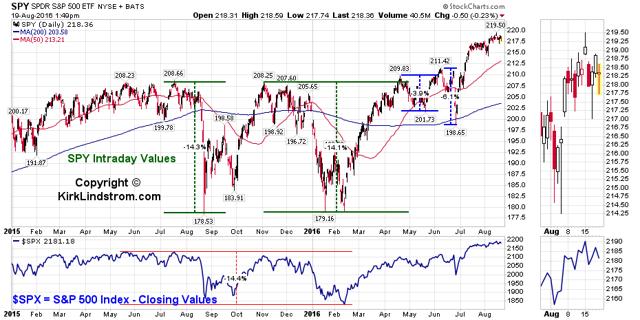
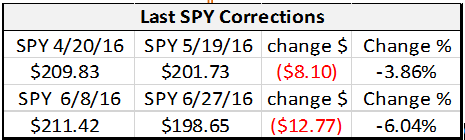
Chart 2 below shows the S&P500 and SPY were down over 14% from their record intraday highs three times since last summer. All were great times to buy or add to your positions. Pullbacks between 3% and 14% can also be good times to buy back shares if you use sentiment charts to help identify a turn in the markets.
Notice Chart 2 also shows that SPY traded down and slightly penetrated its 200-day moving average, MA(200), in June 2016 before reversing to make a new intraday high last week.
Chart 2: SPY Intraday Adjusted for Dividends Over Time
Every week I review my sentiment charts of the weekly data. In this article, I compare the sentiment levels from various surveys in my table to get an idea of overall investor sentiment.
After making his fortune buying during the panic that after Napoleon’s Battle of Waterloo, 18 th century British nobleman and member of the Rothschild banking family, Baron Nathan Rothschild, is often credited for telling his clients that “The time to buy is when there’s blood in the streets.” (See “When There’s Blood In The Streets.”)
For those looking for something more recent and true than the Rothschild story, on page 4 of his 2004 Chairman’s letter Warren Buffet, who is probably one of the greatest investors of all time, wrote, “Investors should remember that excitement and expenses are their enemies. And if they insist on trying to time their participation in equities, they should try to be fearful when others are greedy and greedy when others are fearful.”
I’ve explained in past articles such as “SPY 8% Off Record High While WLI Rises To 6-Week High” why I like SPY as an investment for the long-term. I use fundamentals to pick individual stocks and SPY for my portfolio, but I seldom buy as they are making new 52-week highs. I try to buy when they are on sale and when the blood is running in the streets.
To get better prices, I start with my list of “Explore Portfolio” stock picks then wait for market pullbacks and extreme negative sentiment levels to buy if they haven’t quite reached the “low ball” prices I set ahead of time to buy during market panics and other periods of market inefficiency. Said another way, I like to take profits as markets make new highs then buy back shares when my sentiment charts loudly shout at once “Buy” as most investors are afraid and selling.
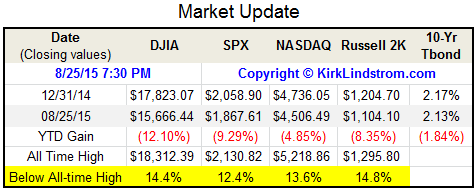
On August 25, 2015, when the S&P500 made its closing low for the year, most of my sentiment indicators were at screaming buy levels not seen since the 21% bear market correction in 2011. Below is a market summary for the 8/25/15 closing prices showing four major indexes were down double digits from record highs. Several of the stocks I bought during that time last year recovered and I took some profits as sentiment recovered. Now I am ready to buy again if the markets go lower to hit my buy zones with a further decline in sentiment or take more profits if the markets continue higher.
TABLE 3: Market Levels Compared with Benchmarks for the Aug. 25, 2015 Low
As I wrote in my Unique Finance articles, I used that period of weakness to add to positions then I took profits as the markets recovered in the end of 2015.
If you have other favorite sentiment indicators you want tracked in my articles, then let me know in the comments and I will consider adding them to future articles.
What follows are the charts and brief explanations for the measures of sentiment I follow, in no particular order of importance.
Chart 3a: Put-to-Call Ratio – 10 & 66 day moving averages – 10-Years:
This chart shows the ten day moving average, MA(10), of the Put-to-Call ratio was above its 1.25 peak value at the bottom of the 2011 mini bear market correction.
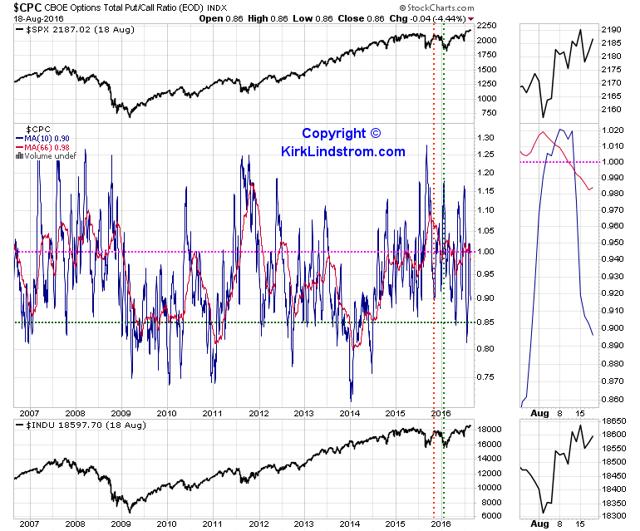
Chart courtesy of Stockcharts.com
Chart 3b: Put-to-Call Ratio – 10 day moving average – 3-Years
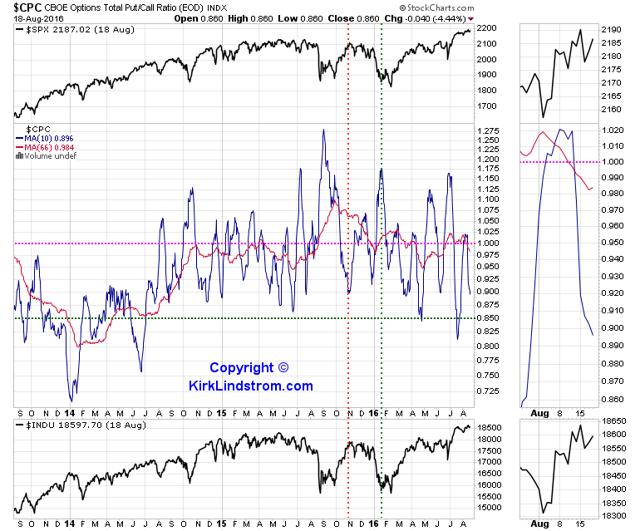
On July 7th, I wrote, “These CPC charts are now at levels of “fear” that we often see at the start of a new rally. Perhaps that rally will be a break-out above the long trading range of the S&P500.”
Clearly, I was correct as the markets rallied to new record highs. With the plunge in CPC as the markets trade close to their record highs, taking profits is wise in the event the next pullback is larger than a few percent required to reset CPC.
Today these CPC charts suggest a pull-back, or at least a narrow trading range for the S&P500, before the next advance. Other measures of sentiment, not covered in this article such as historically low interest rates, suggest stocks can still go higher long-term so it remains nearly impossible to “call tops” from any individual set of indicators.
The bears will say yet again that this is one more chance to get out now near yet another record high before the market collapses. They sure must get hoarse from this warning.
Personally, I rebalance or take profits near market highs so I have cash to buy potential future declines. If the markets continue higher and never return, then I spend some of the cash and take more profits.
Chart 4a: AAII American Association of Individual Investors Sentiment Survey
These AAII numbers are posted weekly here on Unique Finance. From AAII Sentiment Indicator, “The sentiment survey, taken once a week on the AAII web site, measures the percentage of individual investors who take the survey who are bullish, neutral and bearish.”
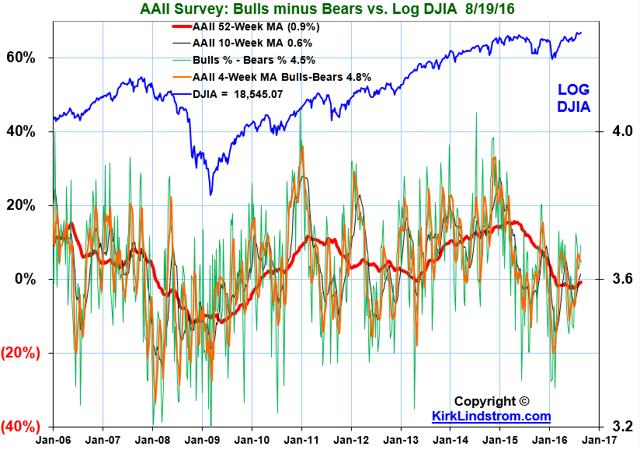
Chart 4b: AAII American Association of Individual Investors Sentiment Survey
Green curve shows a faster signal due to use of weekly data
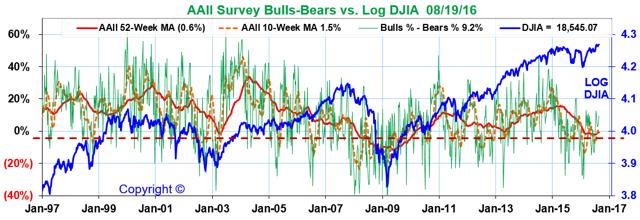
These AAII sentiment charts show the 52-week moving average of the percentage of bulls minus the percentage of bears remains in the rare negative zone for the 28th consecutive week. Also, the weekly data is only slightly bullish at plus 9.2%, certainly not the level of bullishness one would expect at a major market top.
Chart 5a: II: Investor’s Intelligence Survey: Standard Bulls Minus Bears vs the Dow Graph:
From Investors’ Intelligence Sentiment Indicator: The “Investors Intelligence Survey or IIS questions stock-market newsletter writers once a week to see if they were bullish or bearish on the stock markets in the near-term. Newsletter writers have a large following as a group and are thus considered “market experts.” See Investor’s Intelligence web site for more information.
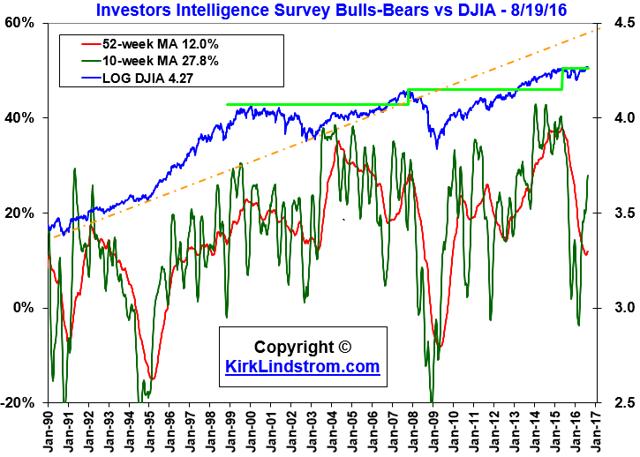
Chart 5b: II: Investor’s Intelligence Survey
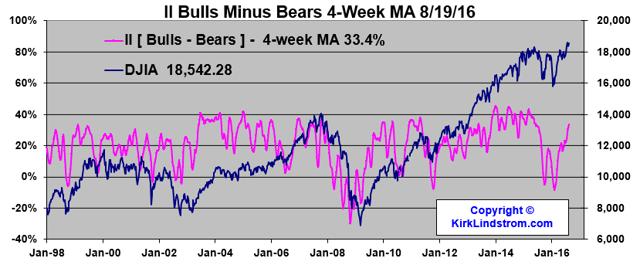
Chart 5c: II: Investor’s Intelligence Survey
In an attempt to account from those who are “neutral” this graph shows the percentage of bulls divided by the percentage of bulls plus bears.
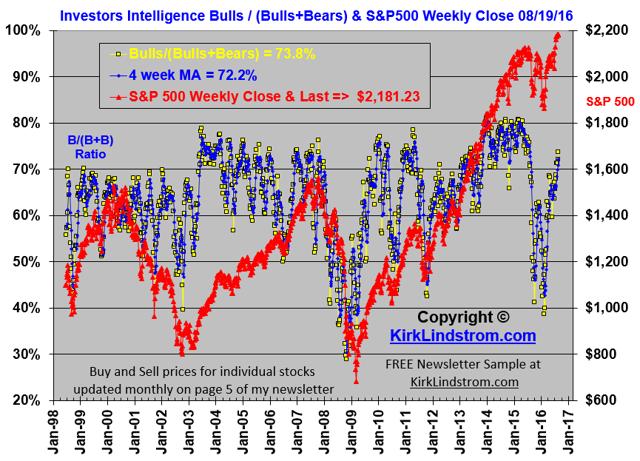
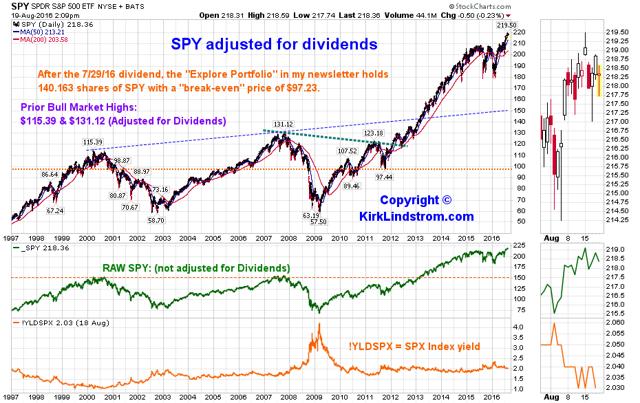
Chart 6: SPY Charts
The top (black) curve is SPY adjusted for dividends. The middle (green) curve is SPY prices not adjusted for dividends. The bottom (orange) curve is the yield of the S&P500 which closely matches the yield of SPY less the small management fee.
From charting sentiment for nearly 20 years, I’ve observed that major market (S&P500 or SPY) bottoms usually line up well with major spikes in the sentiment charts. The absolute levels are not as important as the relative levels of sentiment. For example, notice how the two biggest declines in SPY since the bottom in 2009 align with the two largest spikes in charts 1a and 1b above.
Summary:
I find it helpful to have two monitors so I can pull up my last article to compare the charts side-by-side.
Before last year’s 14% correction since the 2011 mini bear market in the S&P500, corrections were generally 3% to 8% with pundits saying wait for a 10% pullback to get into the market. Over the past two years we’ve had three market declines over 10% from the top, roughly 14% each, yet few of these pundits appear to have jumped on the bull train. Now after two quick corrections over 3% and 6%, some of these bears jumped onto the bull market train. This train may make a sudden, short stop to toss off riders with weak hands and this could happen any day based on many of my sentiment charts.
On Feb. 11 in “With SPY Down 14% Again, Sentiment Charts Suggest Another Tradable Low” I wrote “This should be another great time to add to positions for a tradable rally.” The markets bottomed and SPY rallied to a new high.
Many of my sentiment indicators show bullishness has returned from the “fat-pitch lows” so I remain cautious in the short-term. In the longer term, bullishness is far below levels seen at major market tops. Some backing and filling, perhaps back to the 200- and 50-day moving averages again for SPY (and many stocks I took profits in since then) would be bullish if it came with another nice decline in market sentiment.
Sentiment charts are not perfect. “All or nothing Market timing” seems foolish to me. If you have nothing in the markets, these pullbacks may be your only opportunity before the markets reverse to new highs. Likewise, even if you are extremely bullish for the future, I feel it is always wise to have some cash for the three extraordinary buying opportunities like we saw during the past year when the market was down over 14%.
Notes
I trade SPY around a core position in my newsletter’s “Explore Portfolio” and with my personal account. With dividends reinvested, my newsletter’s explore portfolio holds 139.468 shares of SPY with a “break-even” price, after the 729/16 dividend, of $97.23. I also have the index fund version of SPY in both my newsletter’s “core” portfolios.
SPY is the exchange traded fund for the S&P 500 Index.
VTI is Vanguard’s “Total Stock Market” exchange traded fund. If you want to invest in a single fund, that is my first choice over SPY. I recommend SPY and several other ETFs (or their index fund equivalents at Vanguard and Fidelity) in my core portfolios for more opportunities to rebalance between these funds.
VOO is Vanguard’s newer (than SPY) exchange traded fund that tracks the S&P 500 Index. It is a lower cost alternative to SPY. I own and write about SPY, as I have many years of data for it, but VOO could do slightly better than SPY over time because it has a lower expense ratio.
Disclosure: I am long SPY and own the traditional index fund versions of VTI and VOO bought long ago in various taxable and tax deferred accounts.
Disclosure: I am/we are long SPY.
I wrote this article myself, and it expresses my own opinions. I am not receiving compensation for it (other than from Unique Finance). I have no business relationship with any company whose stock is mentioned in this article.